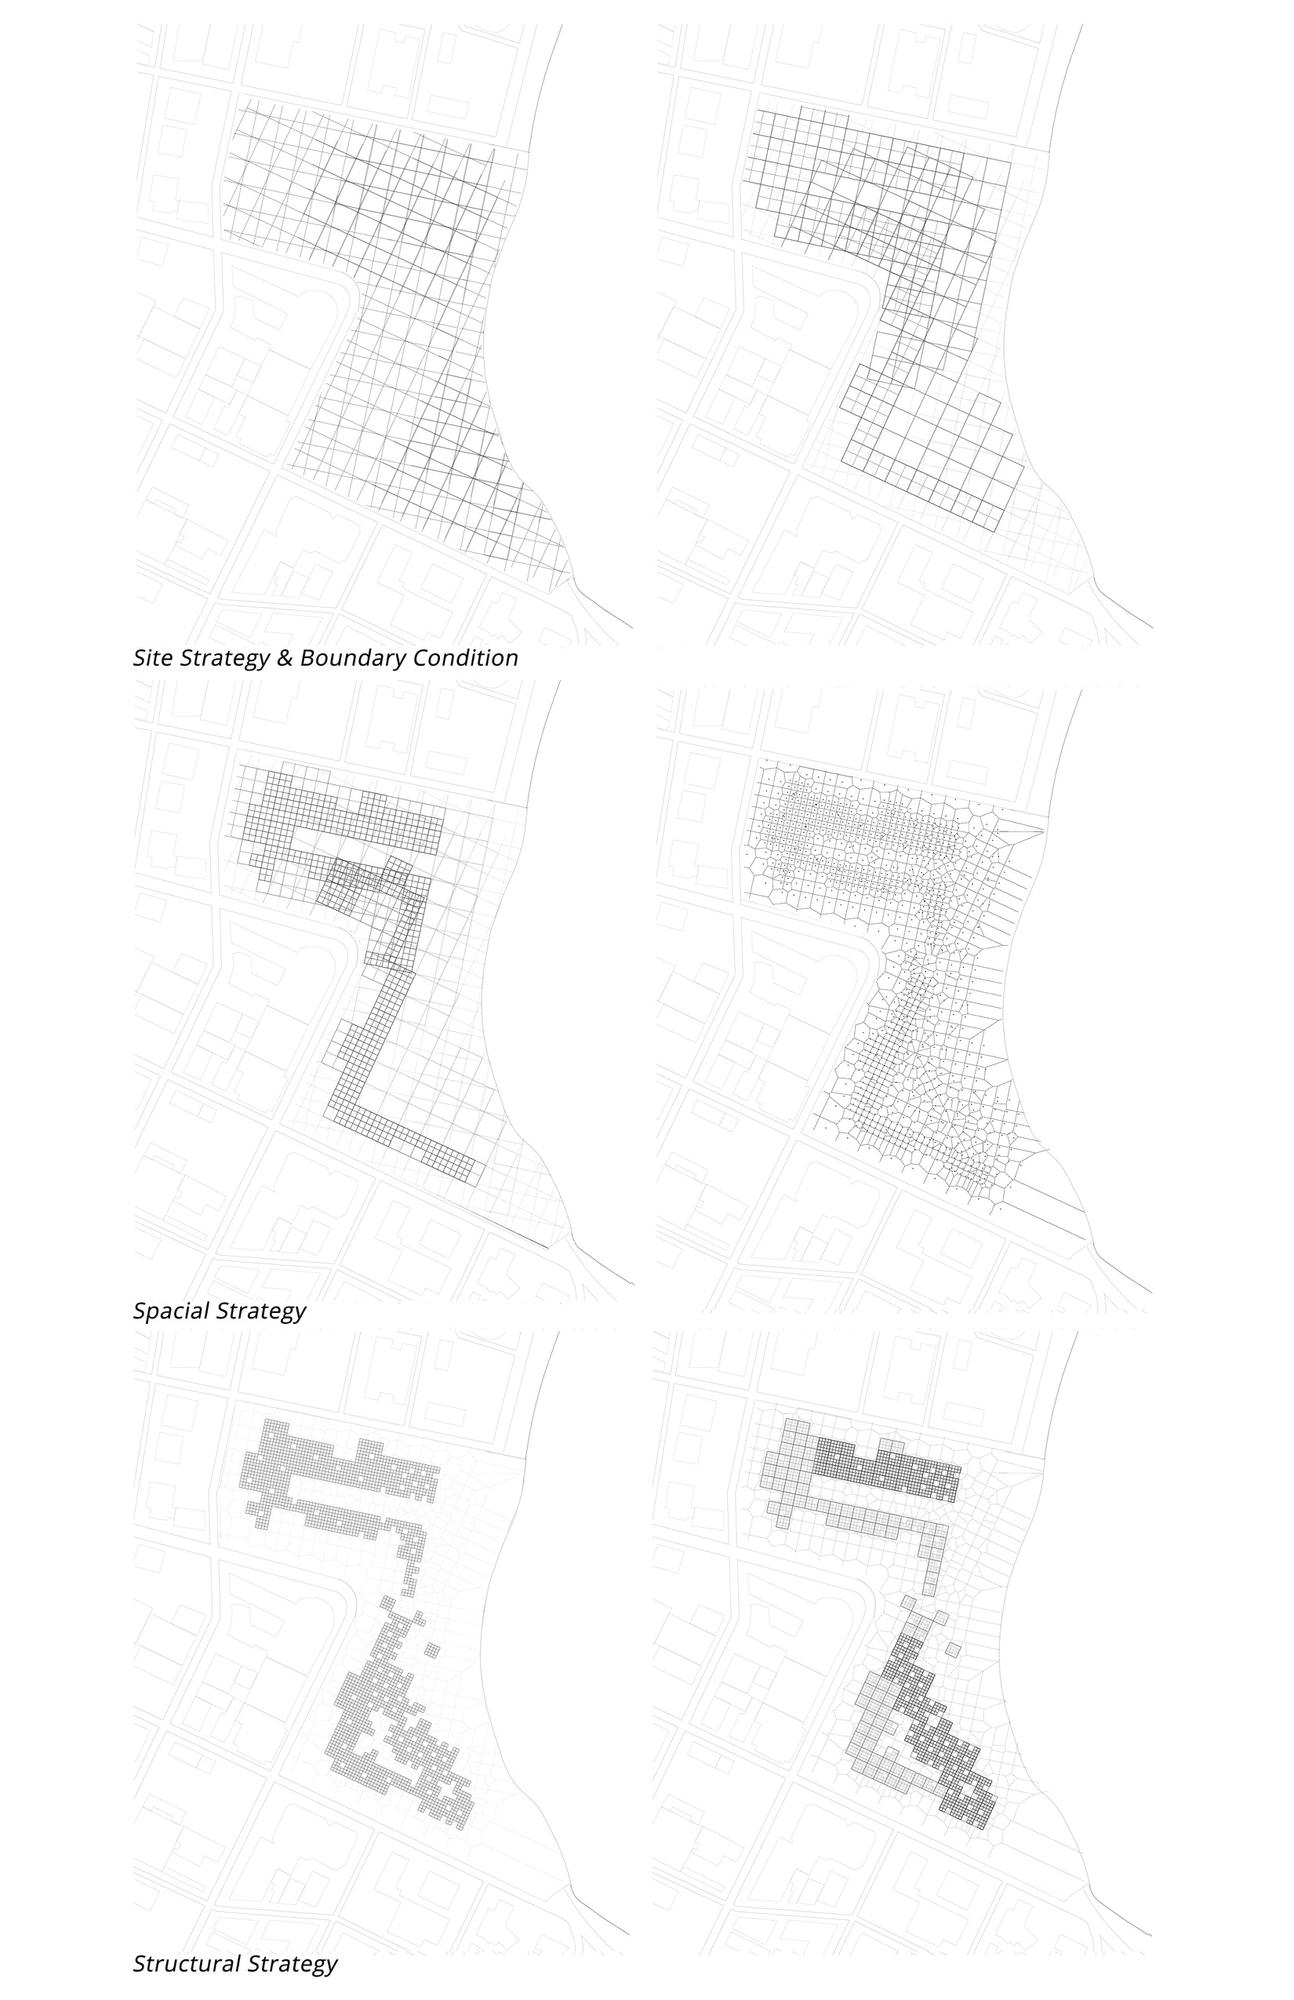
Explicit Design
Qingzhi Li; advised by Jonathan Bachrach, Sara Dean, Etienne Turpin, and Kyle Steinfeld
Computational design forces us to be explicit about our intentions, offering an expedient process to precisely articulate the forms and relationships that drive our designs. Further, it empowers us as designers, amplifying our intended moves and propagating our design patterns at scales not possible through other means.
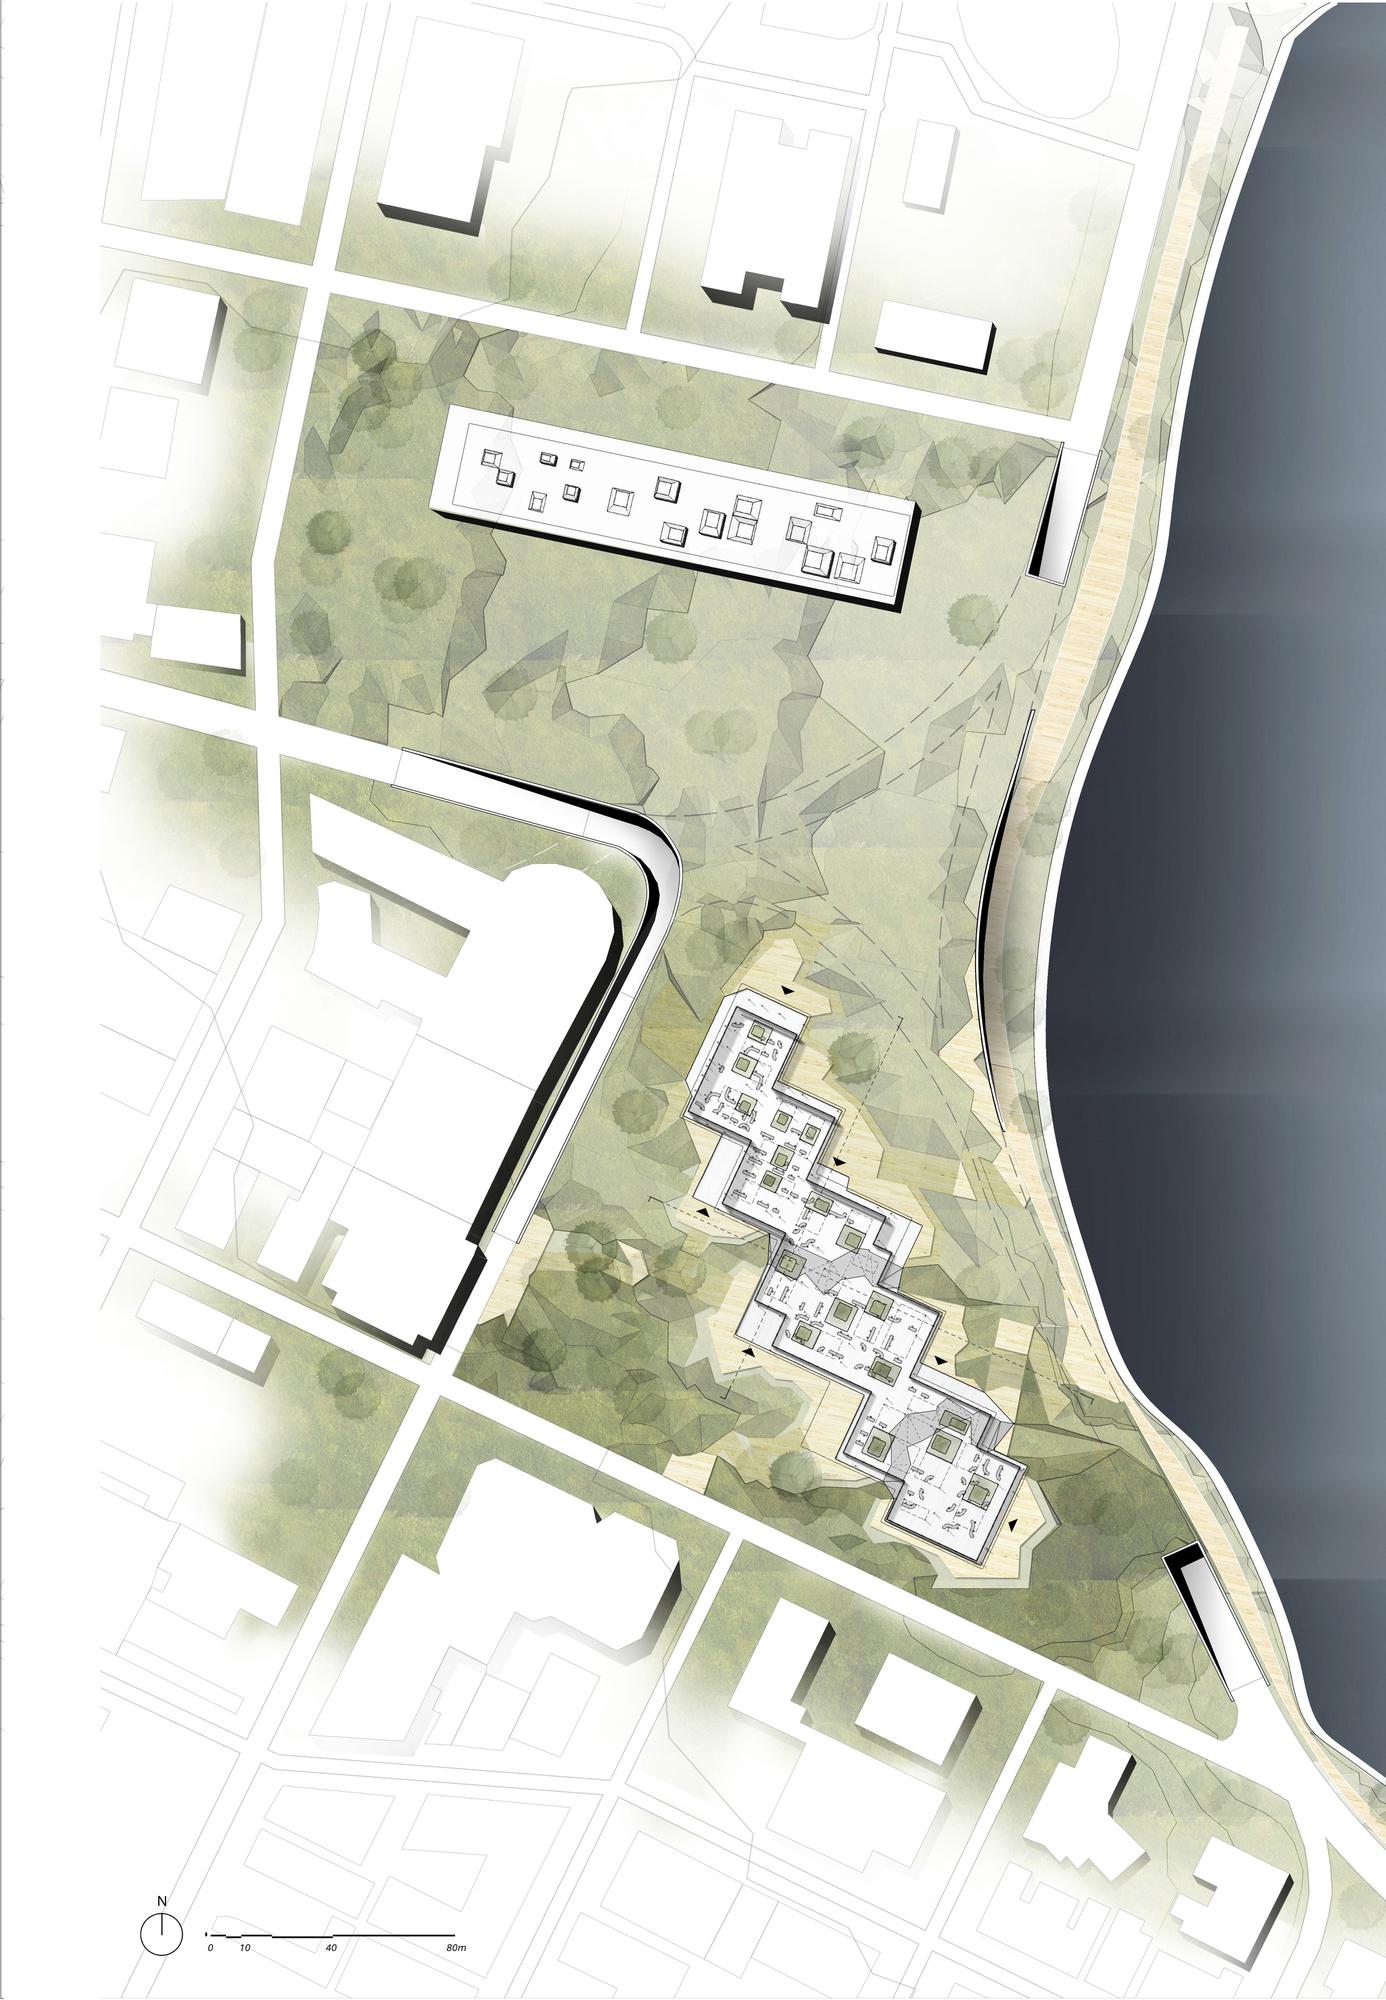
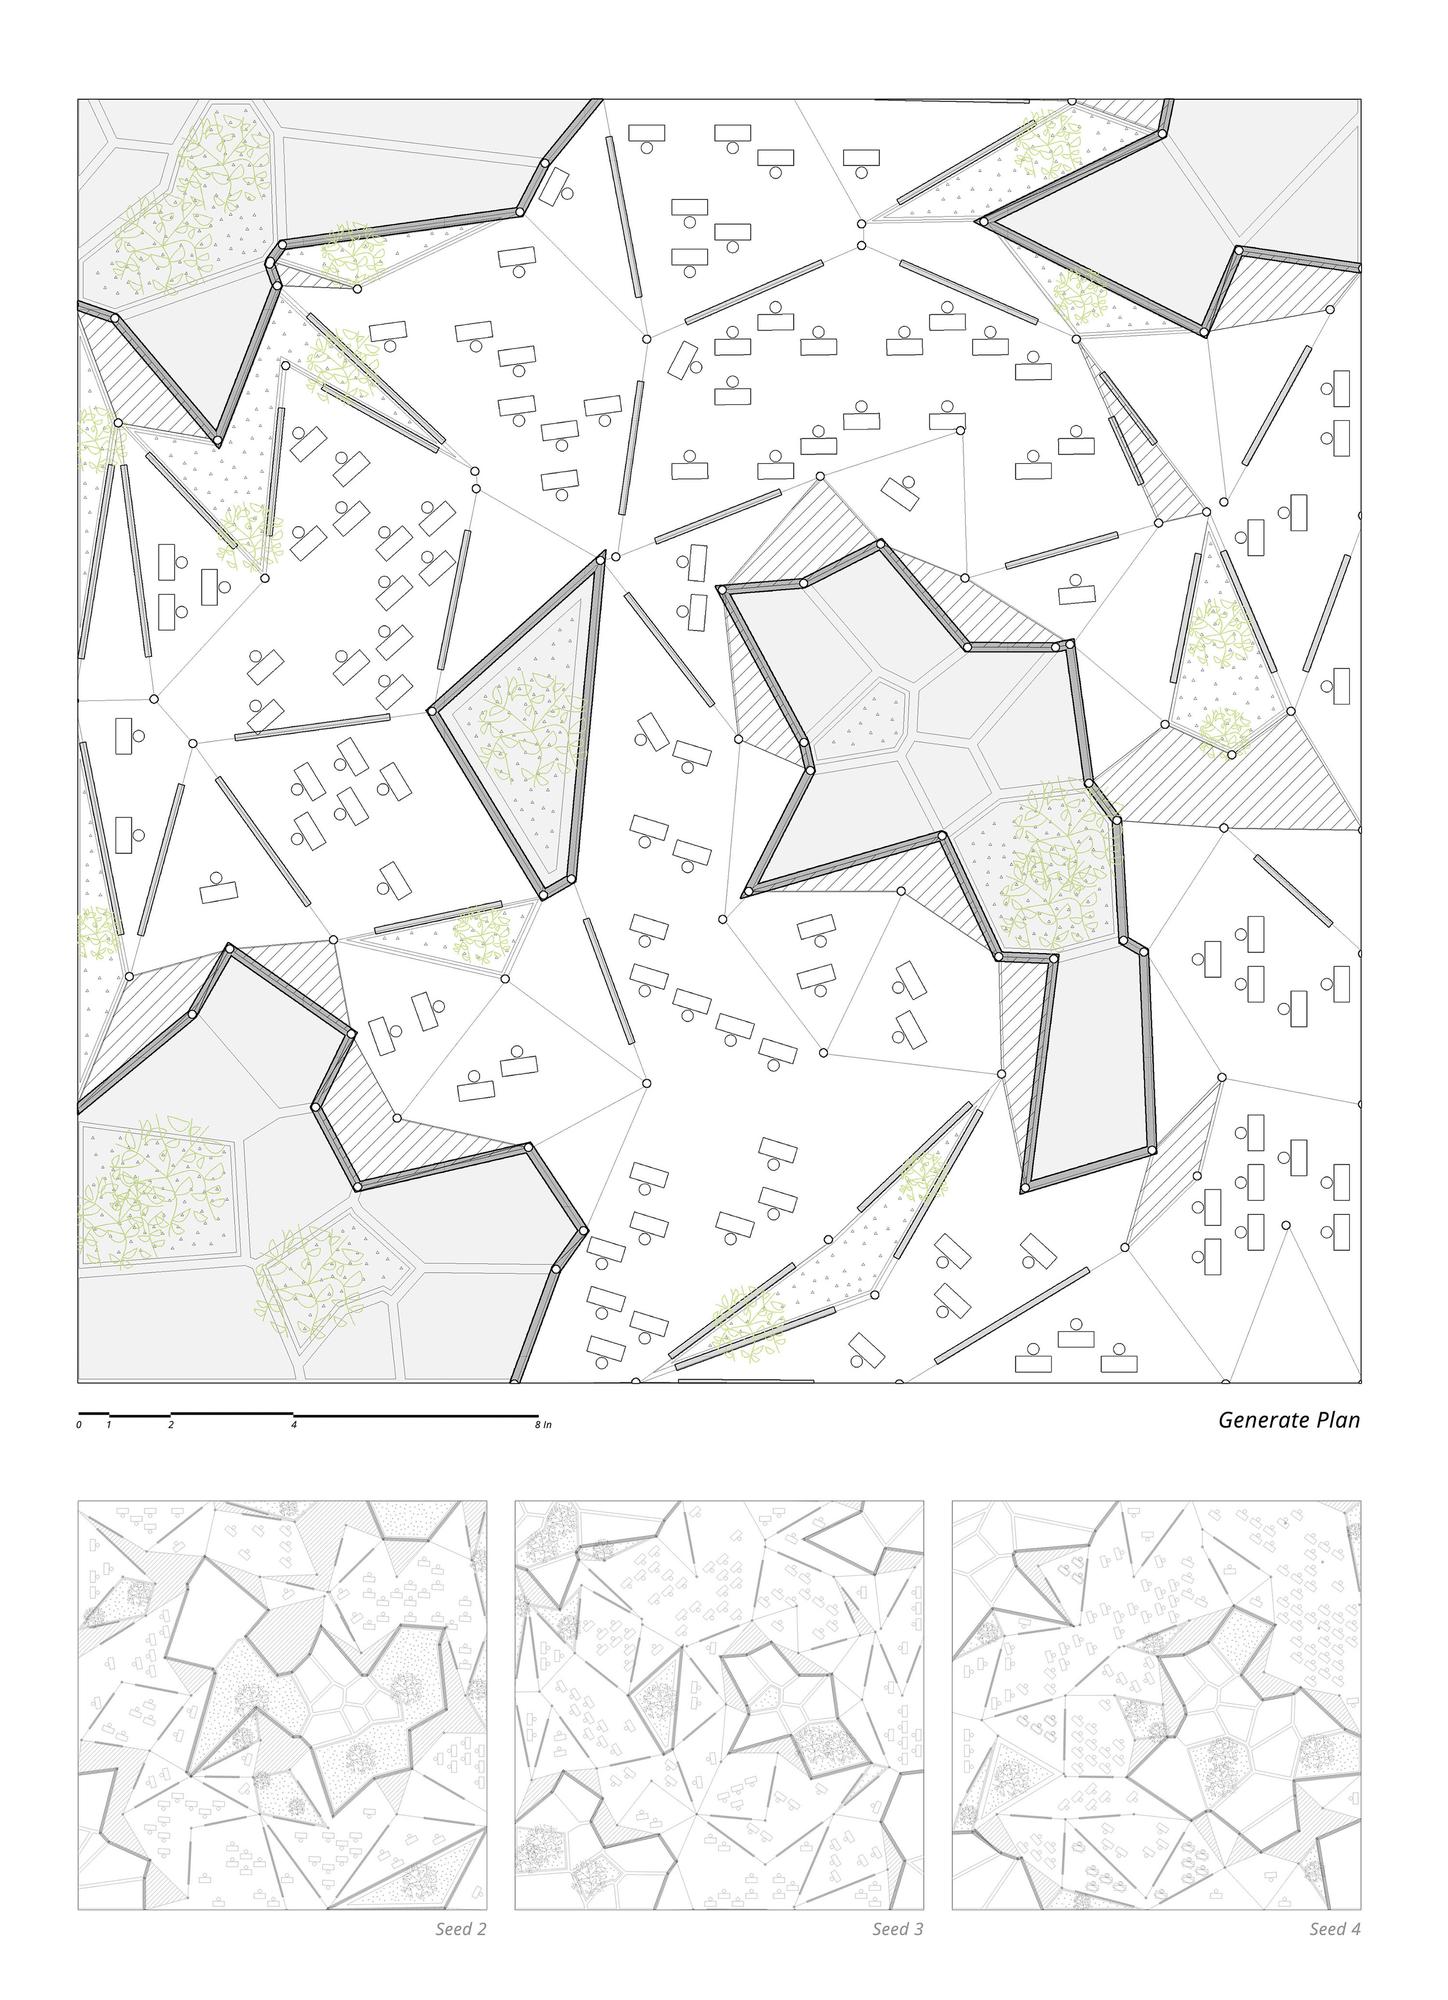
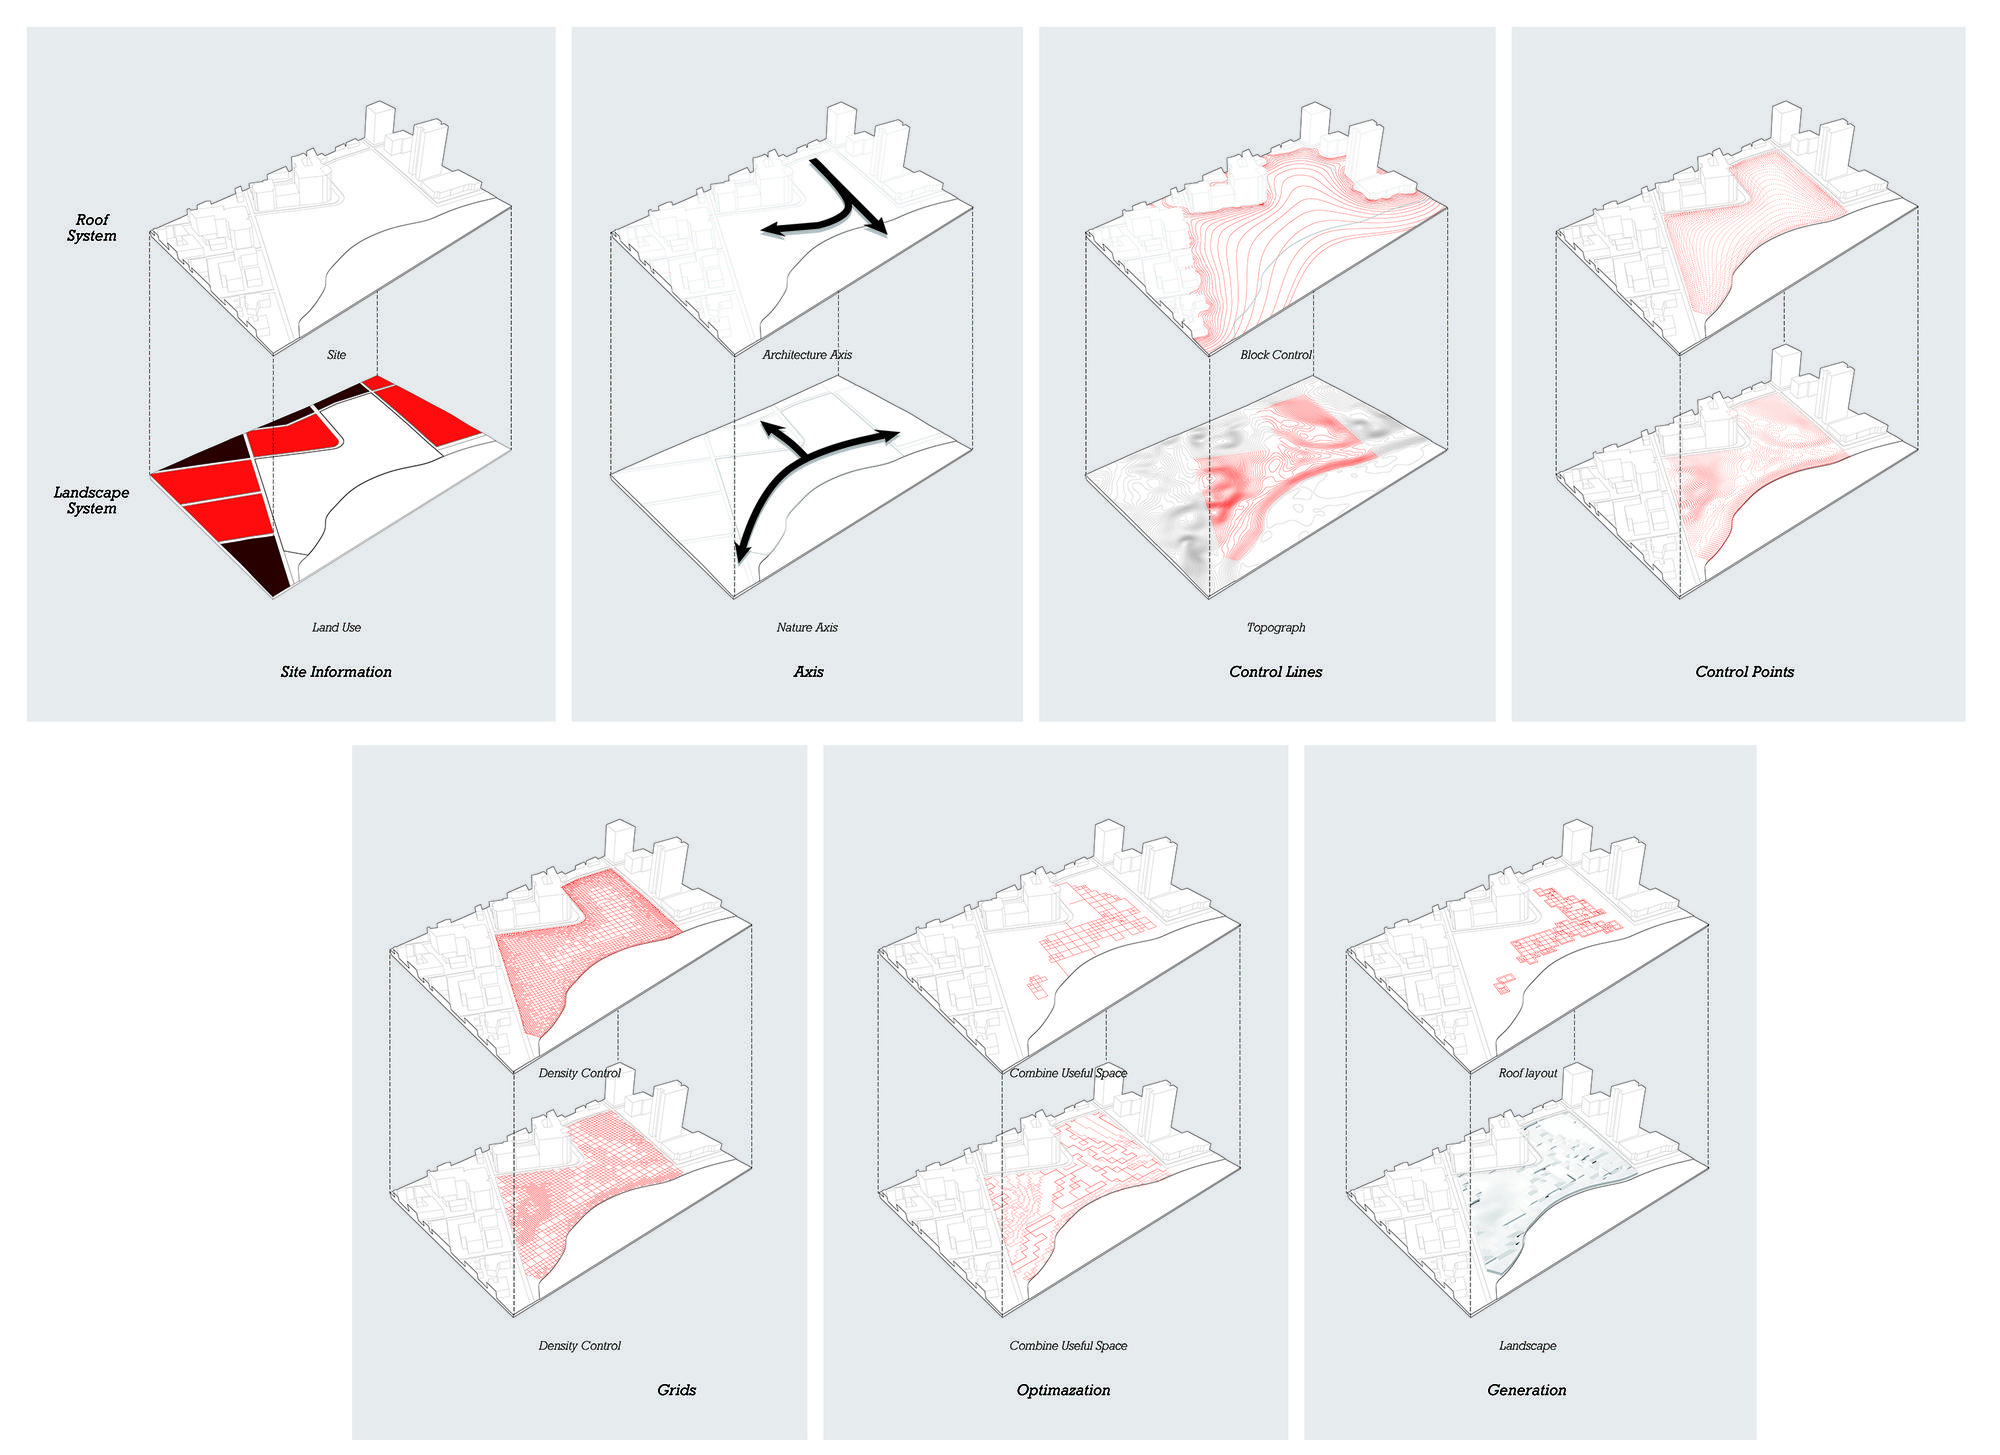
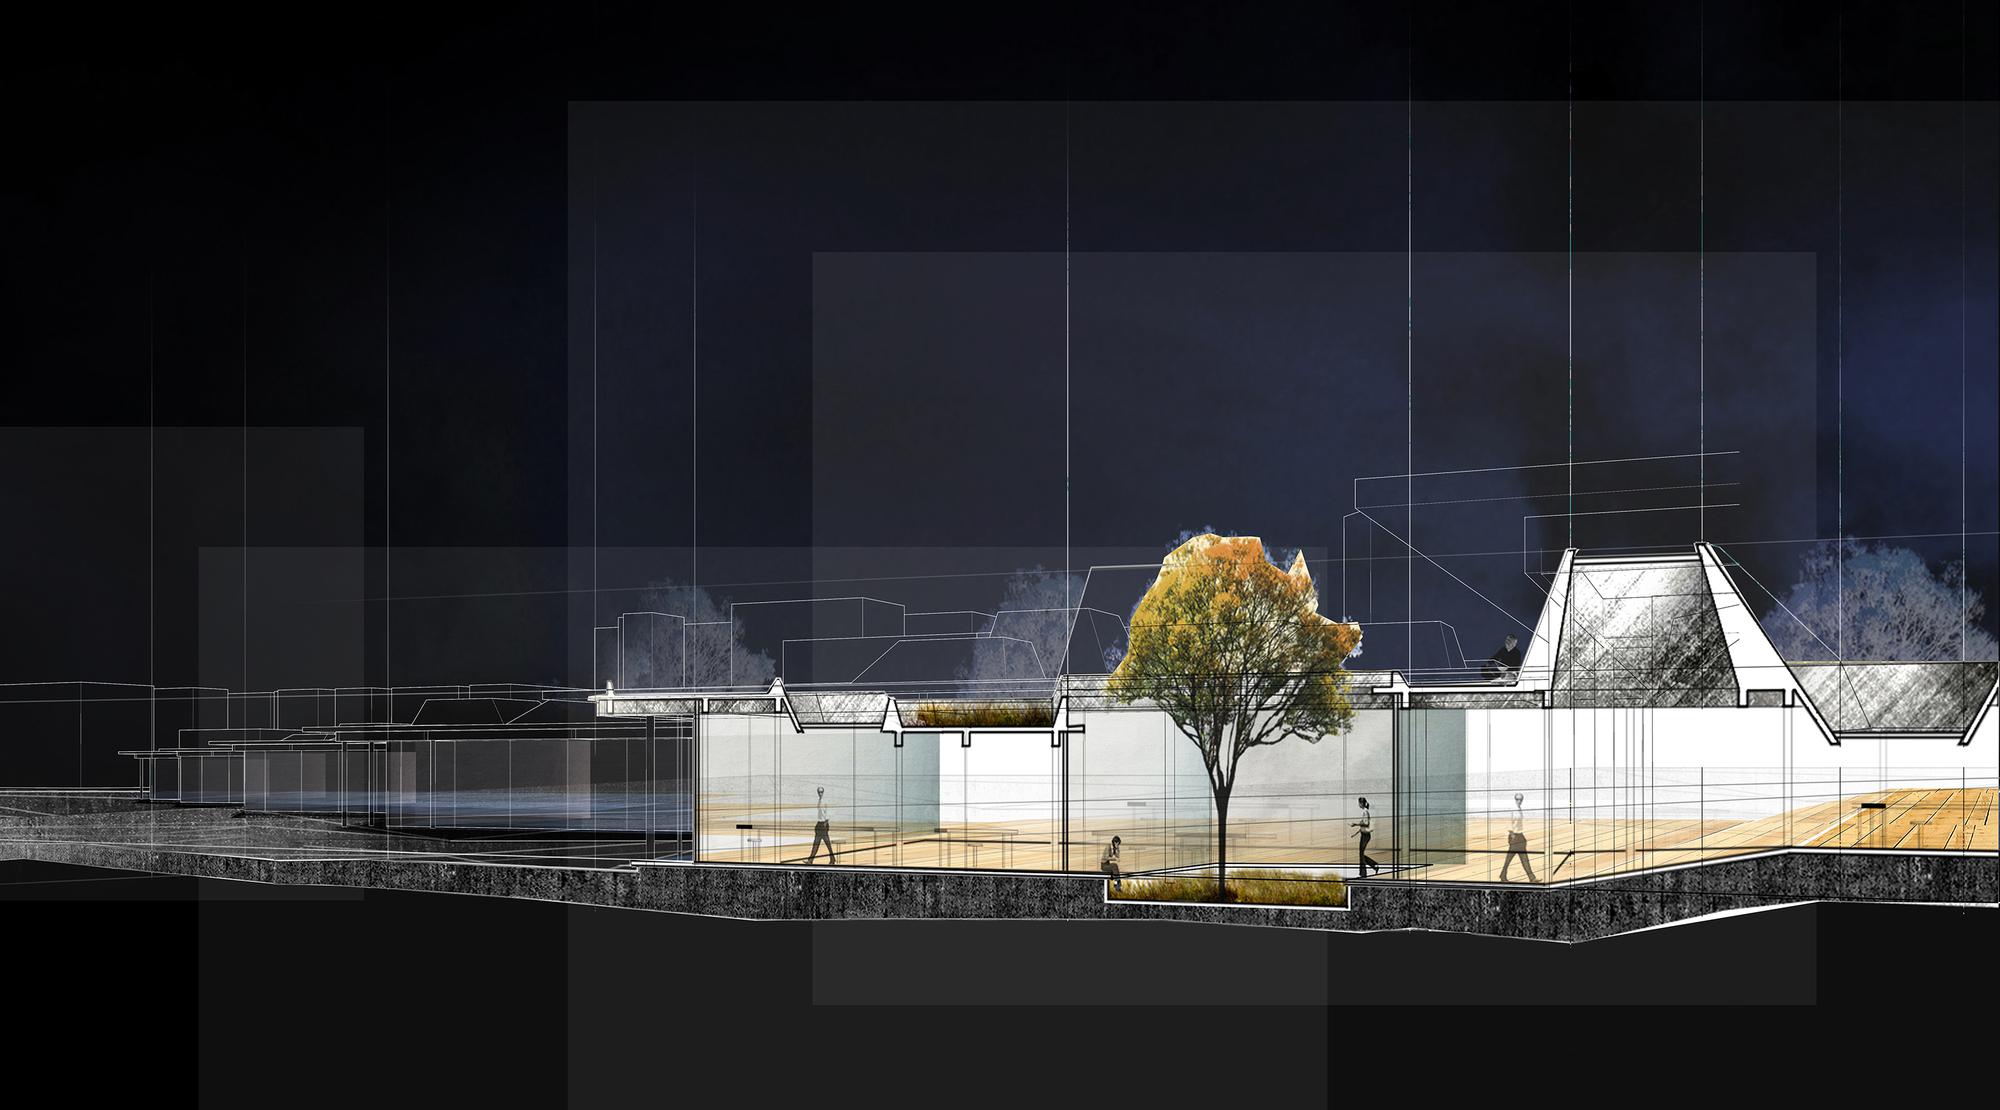
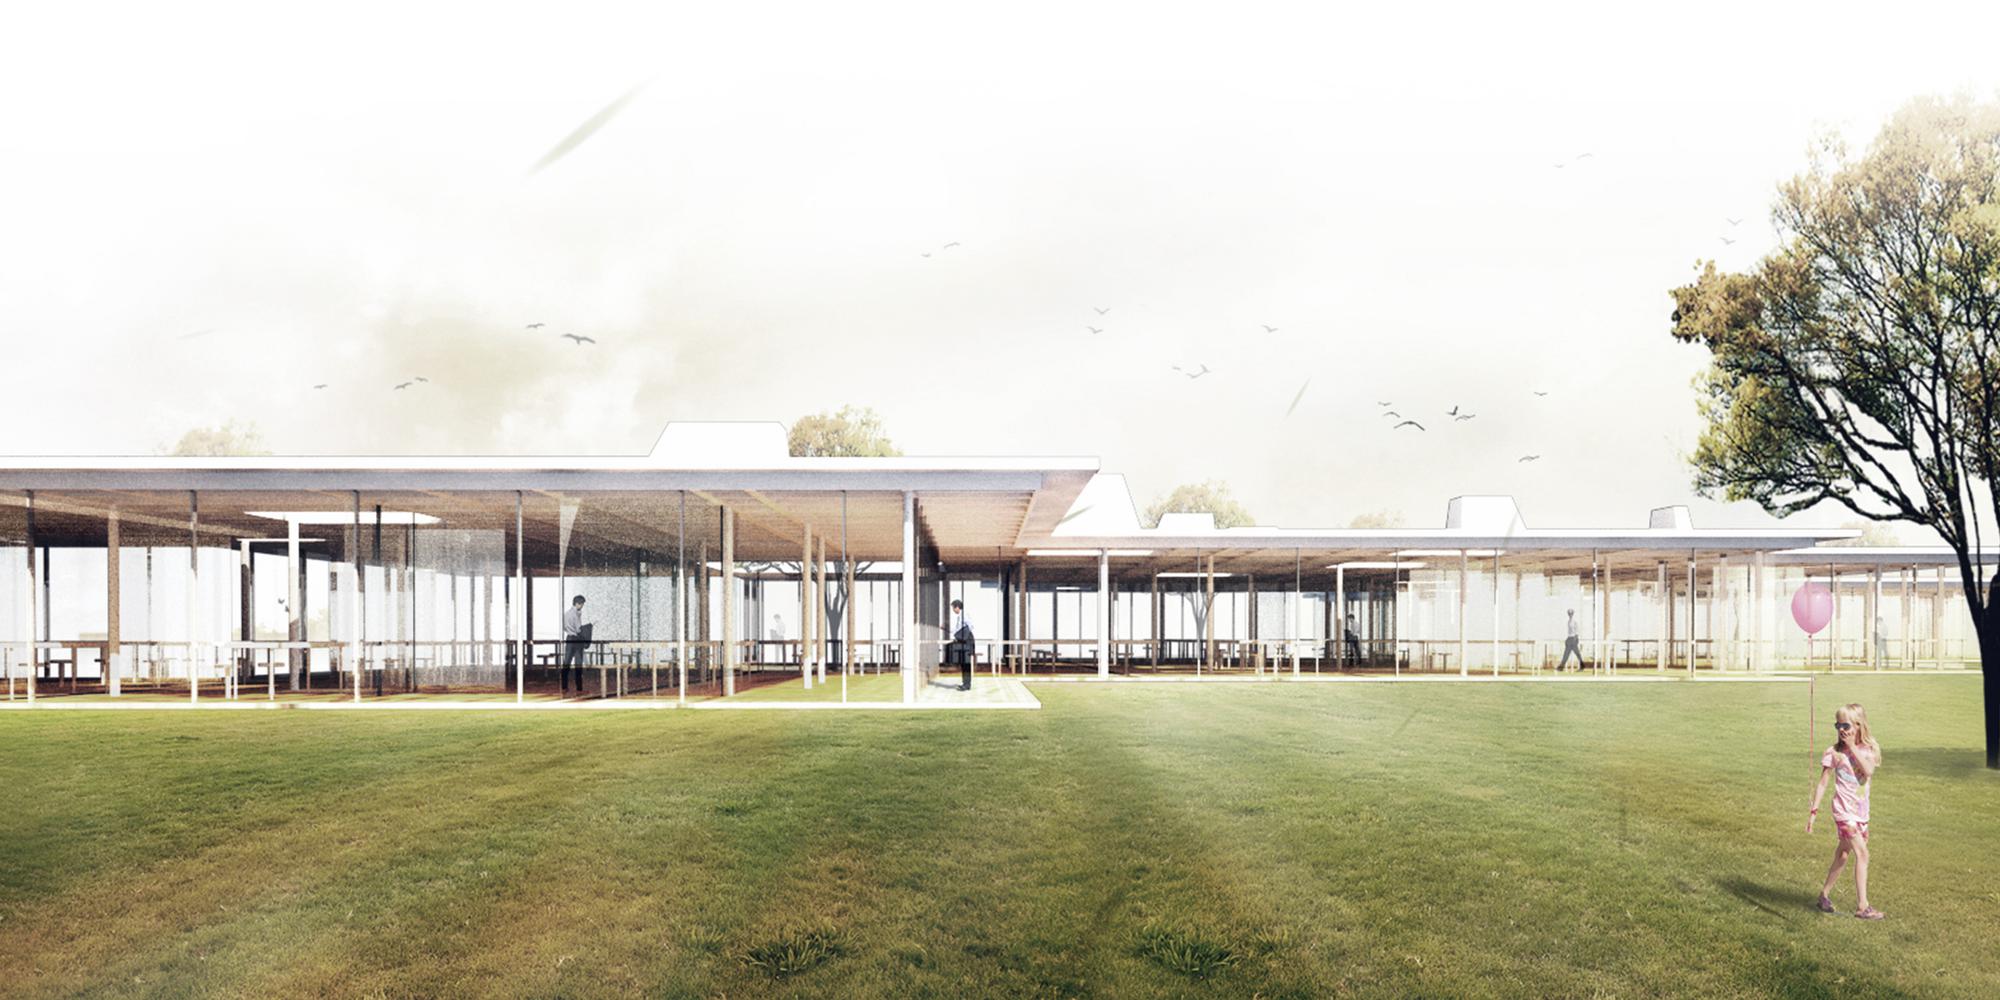
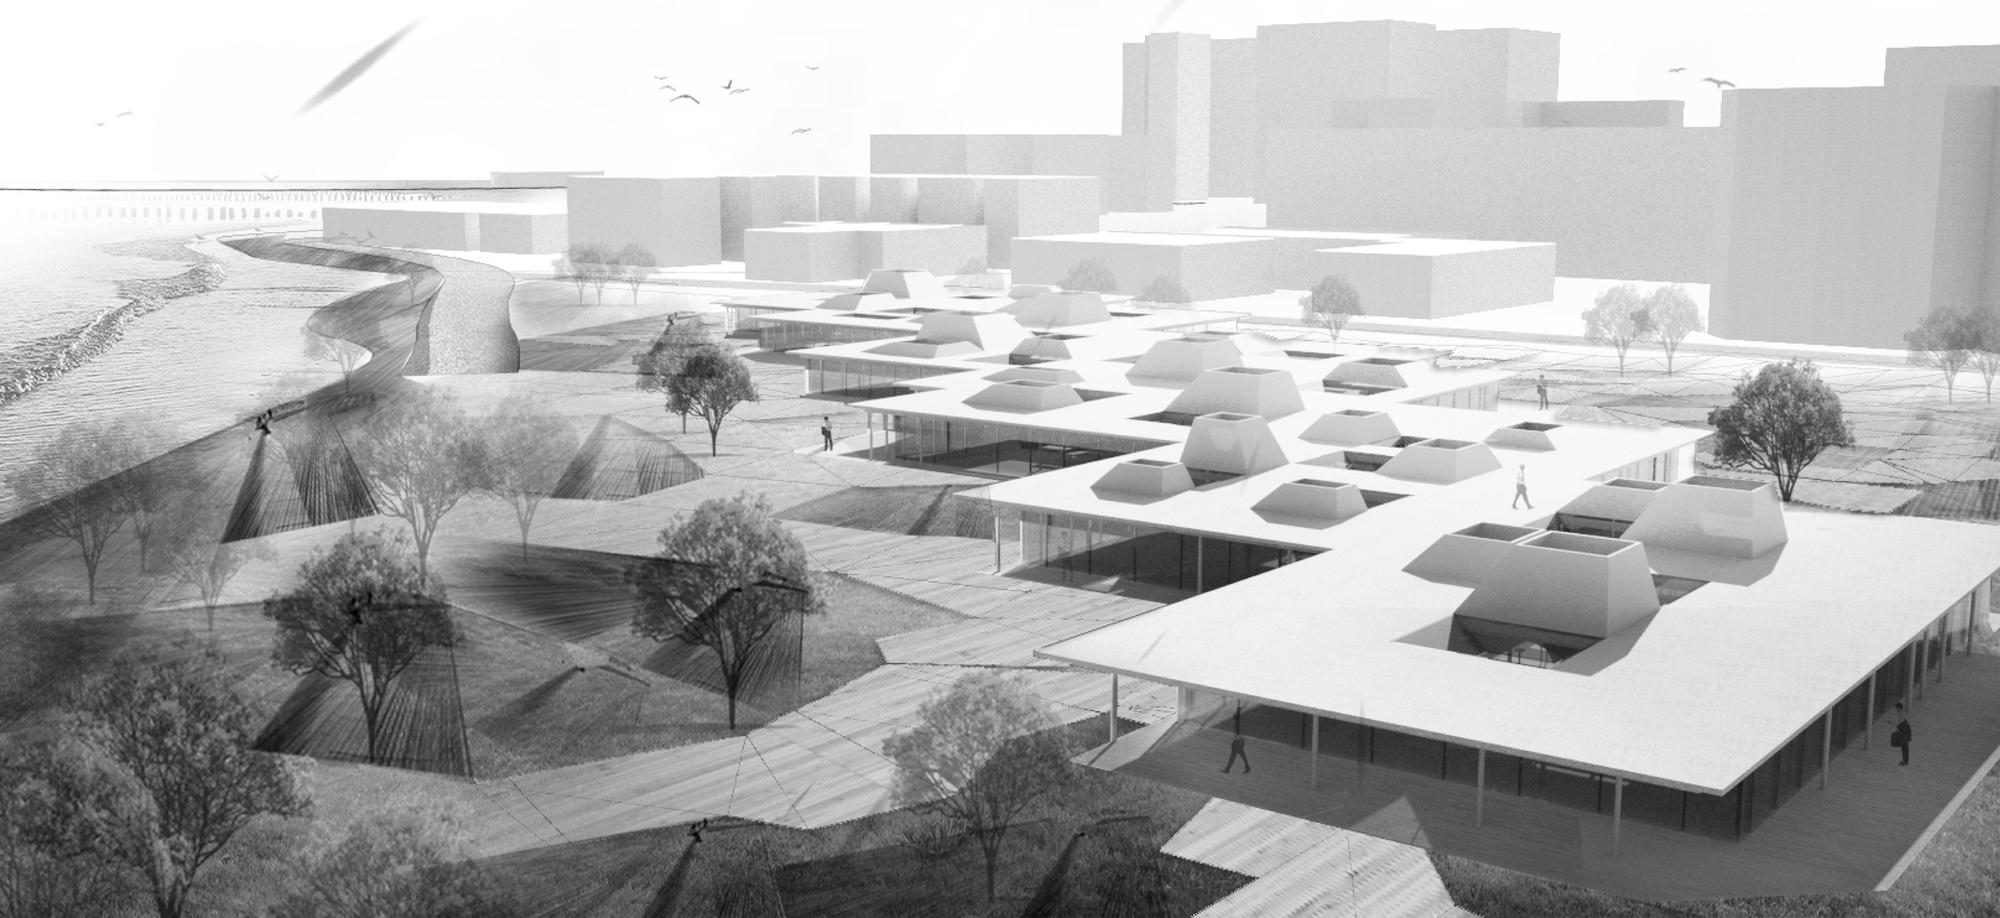
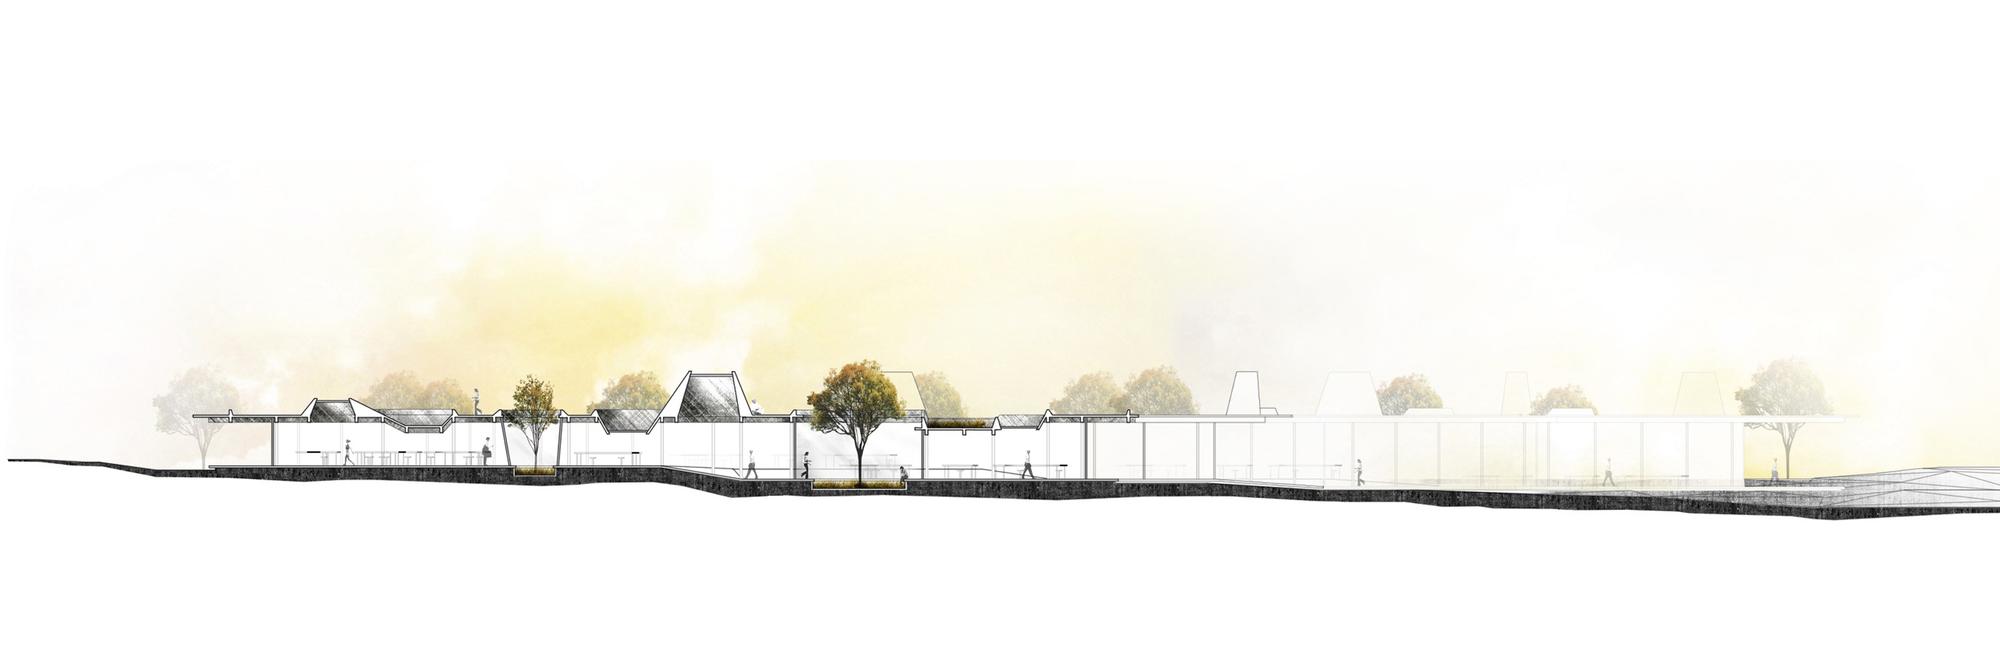
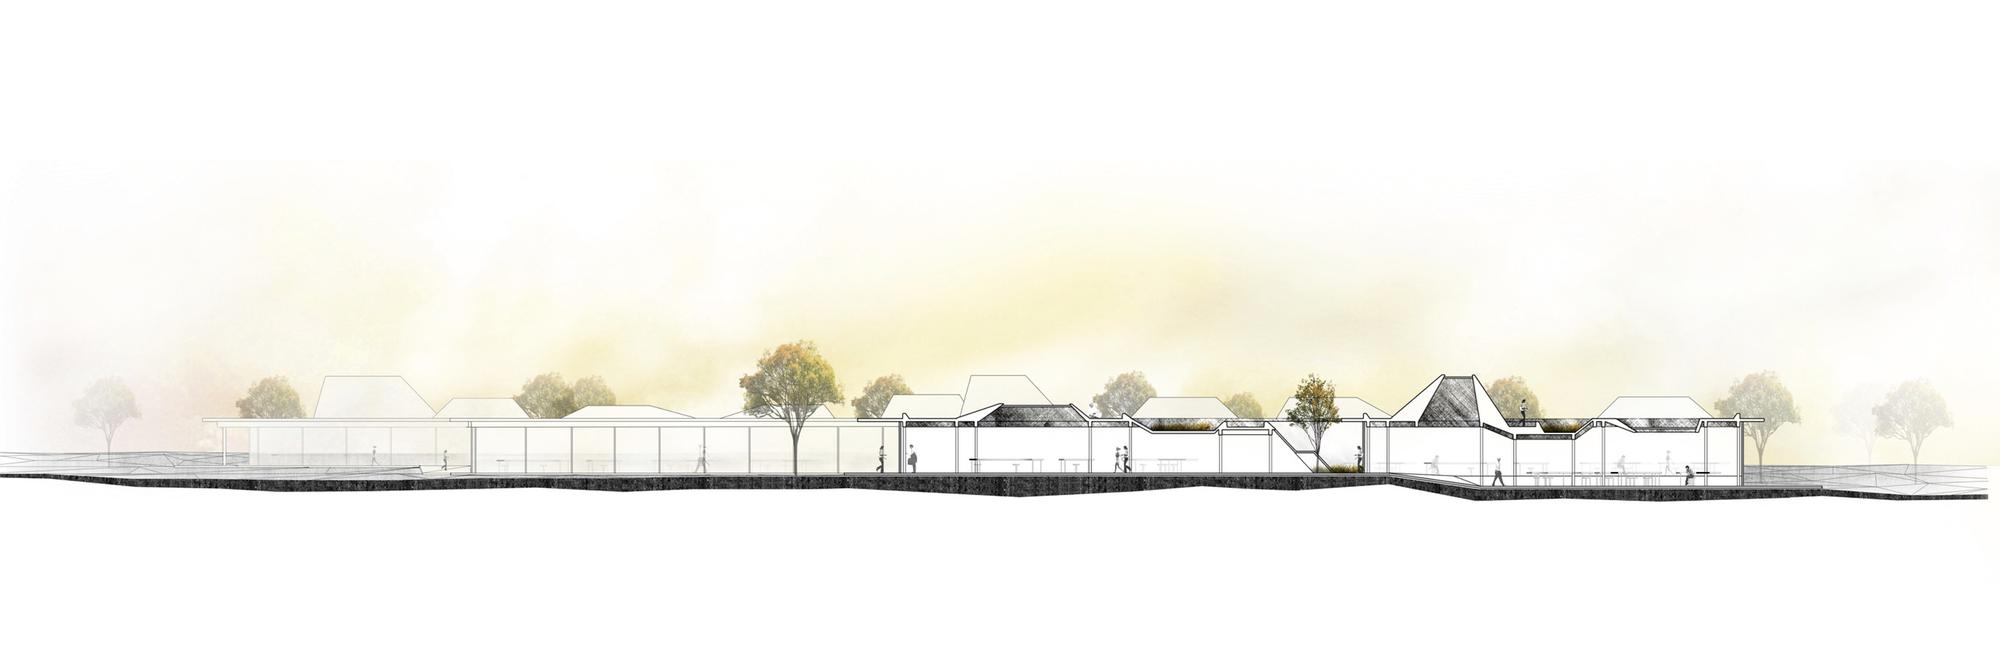
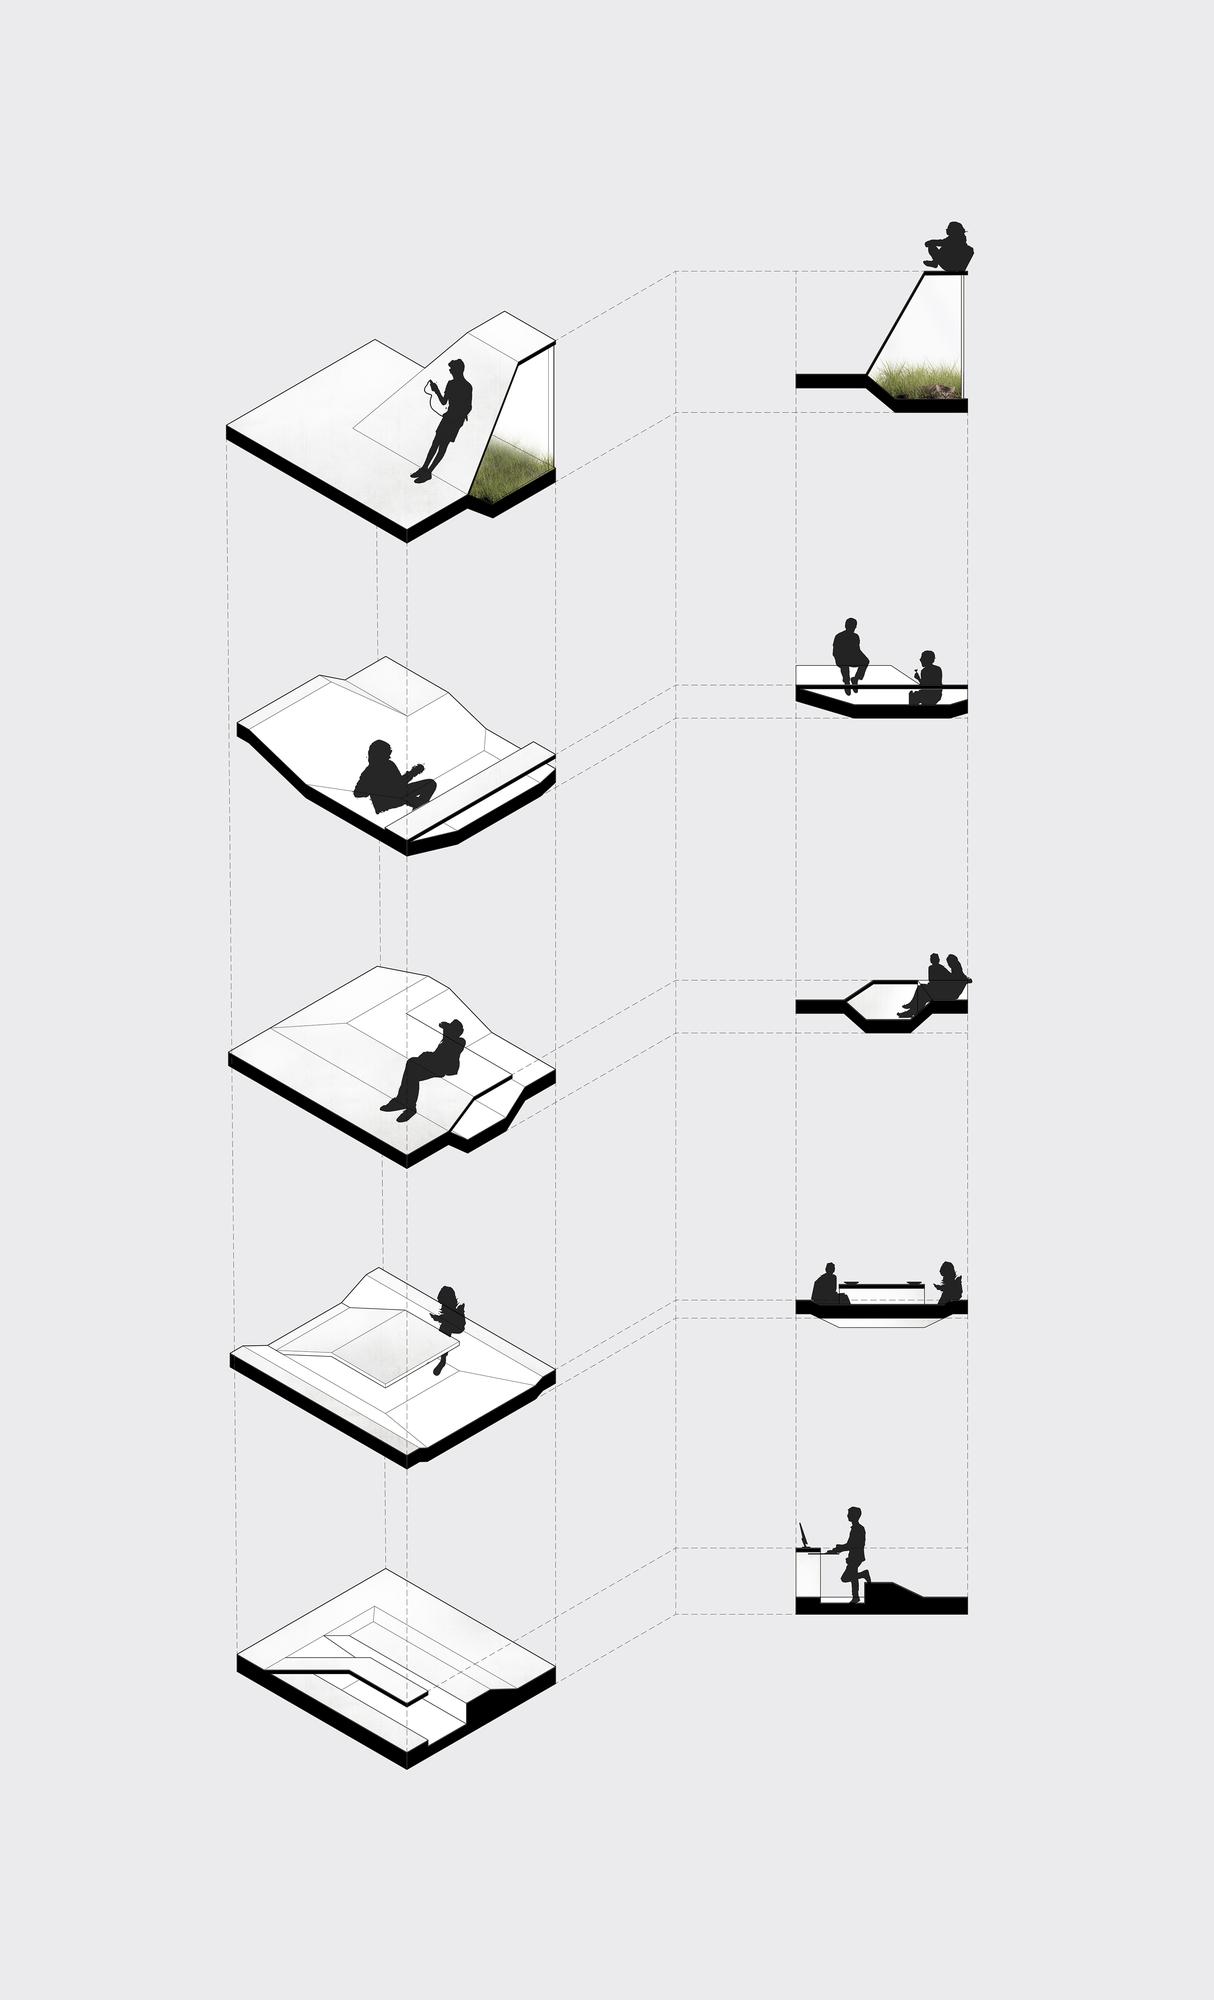
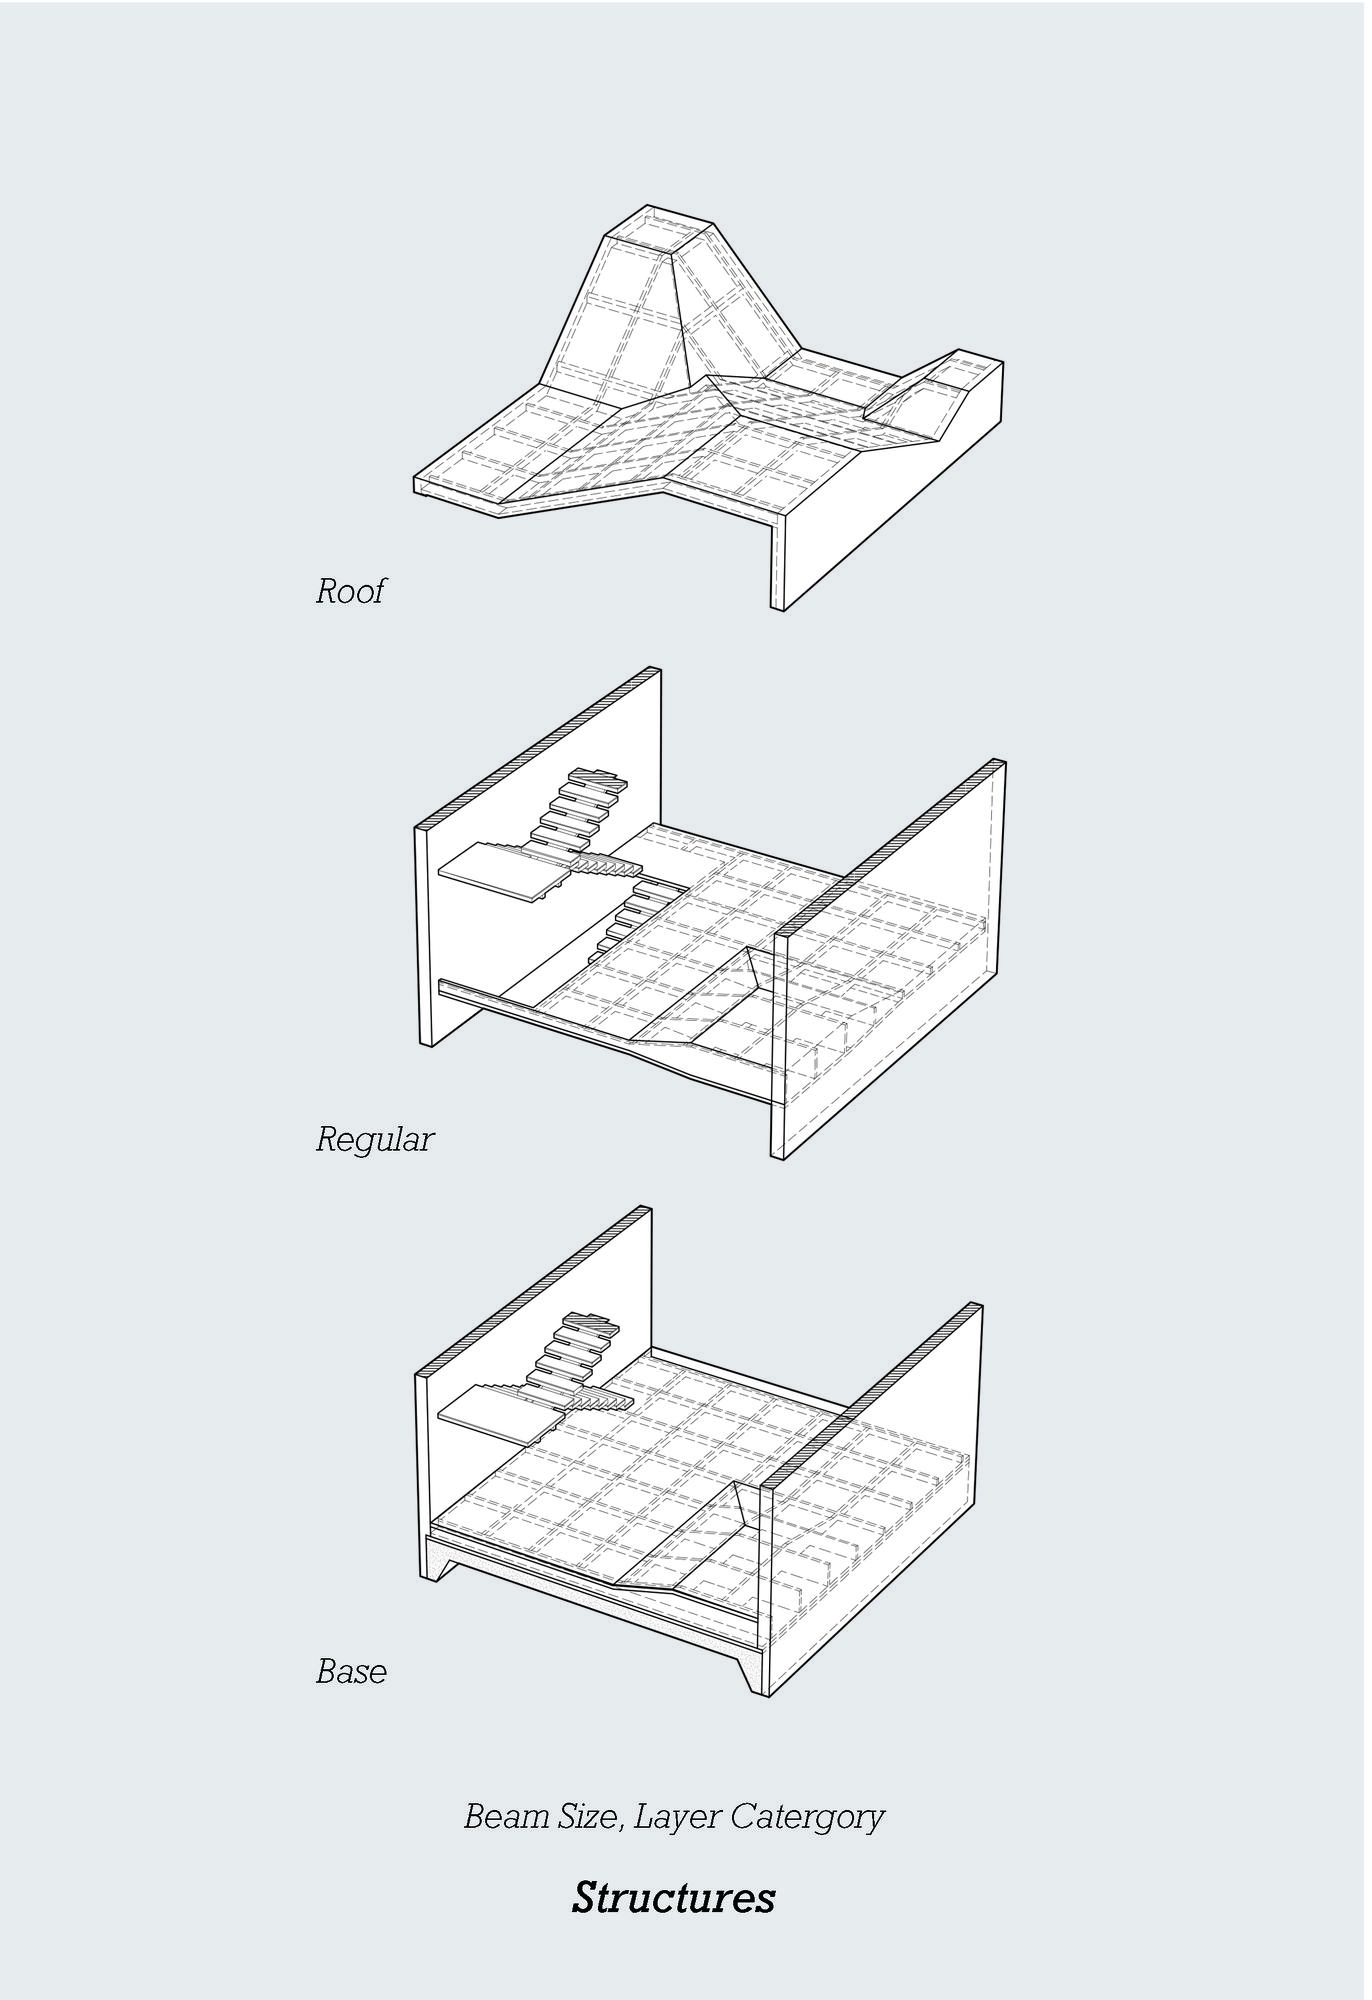
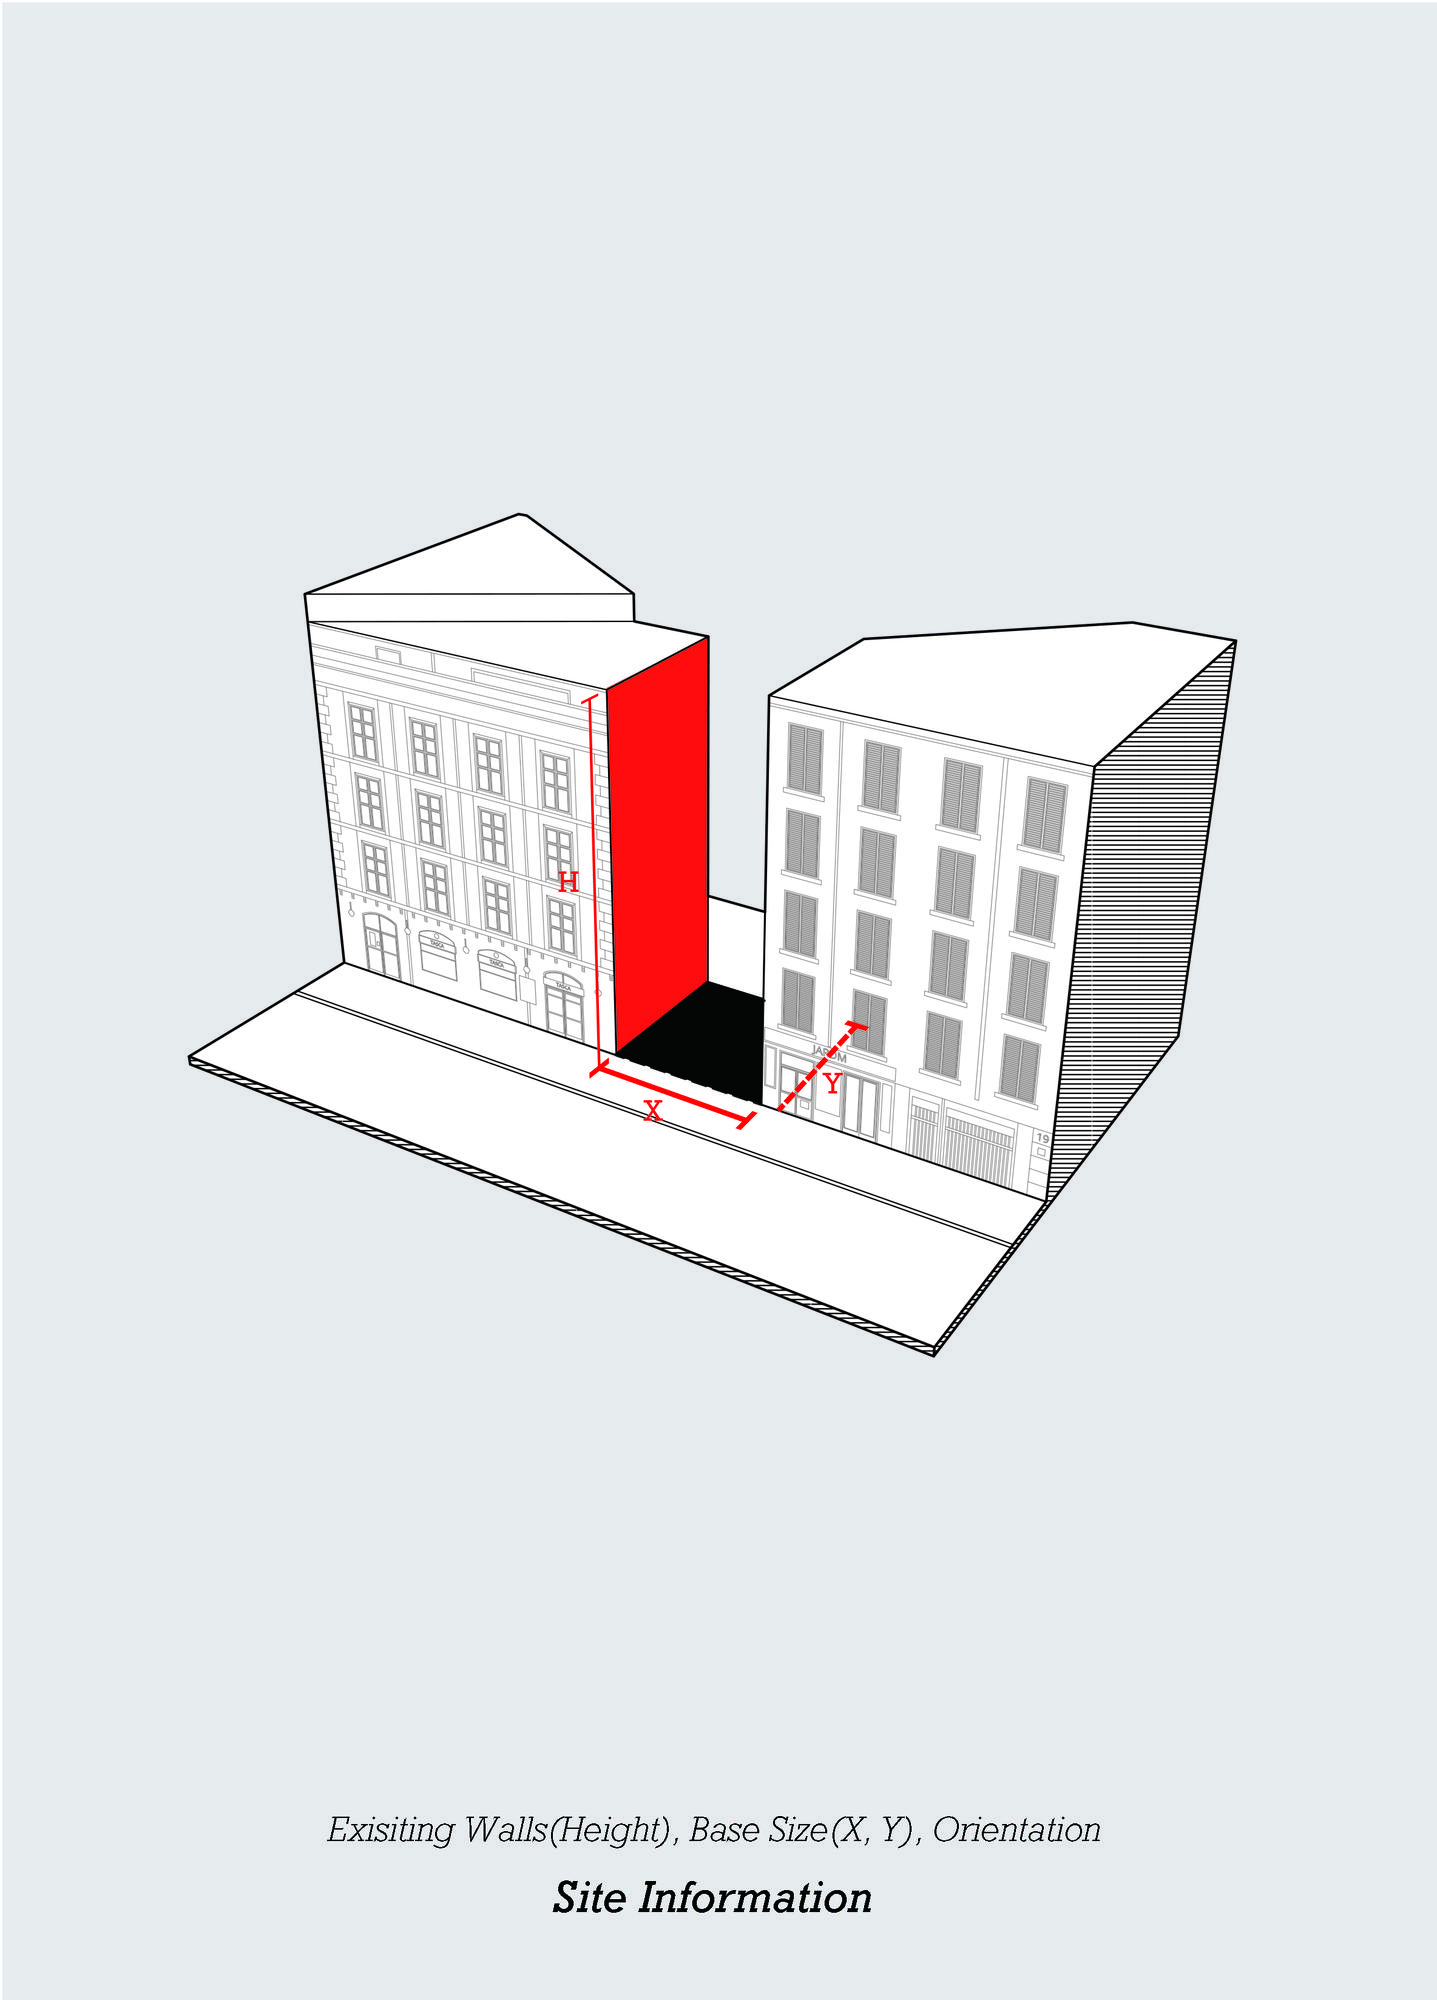
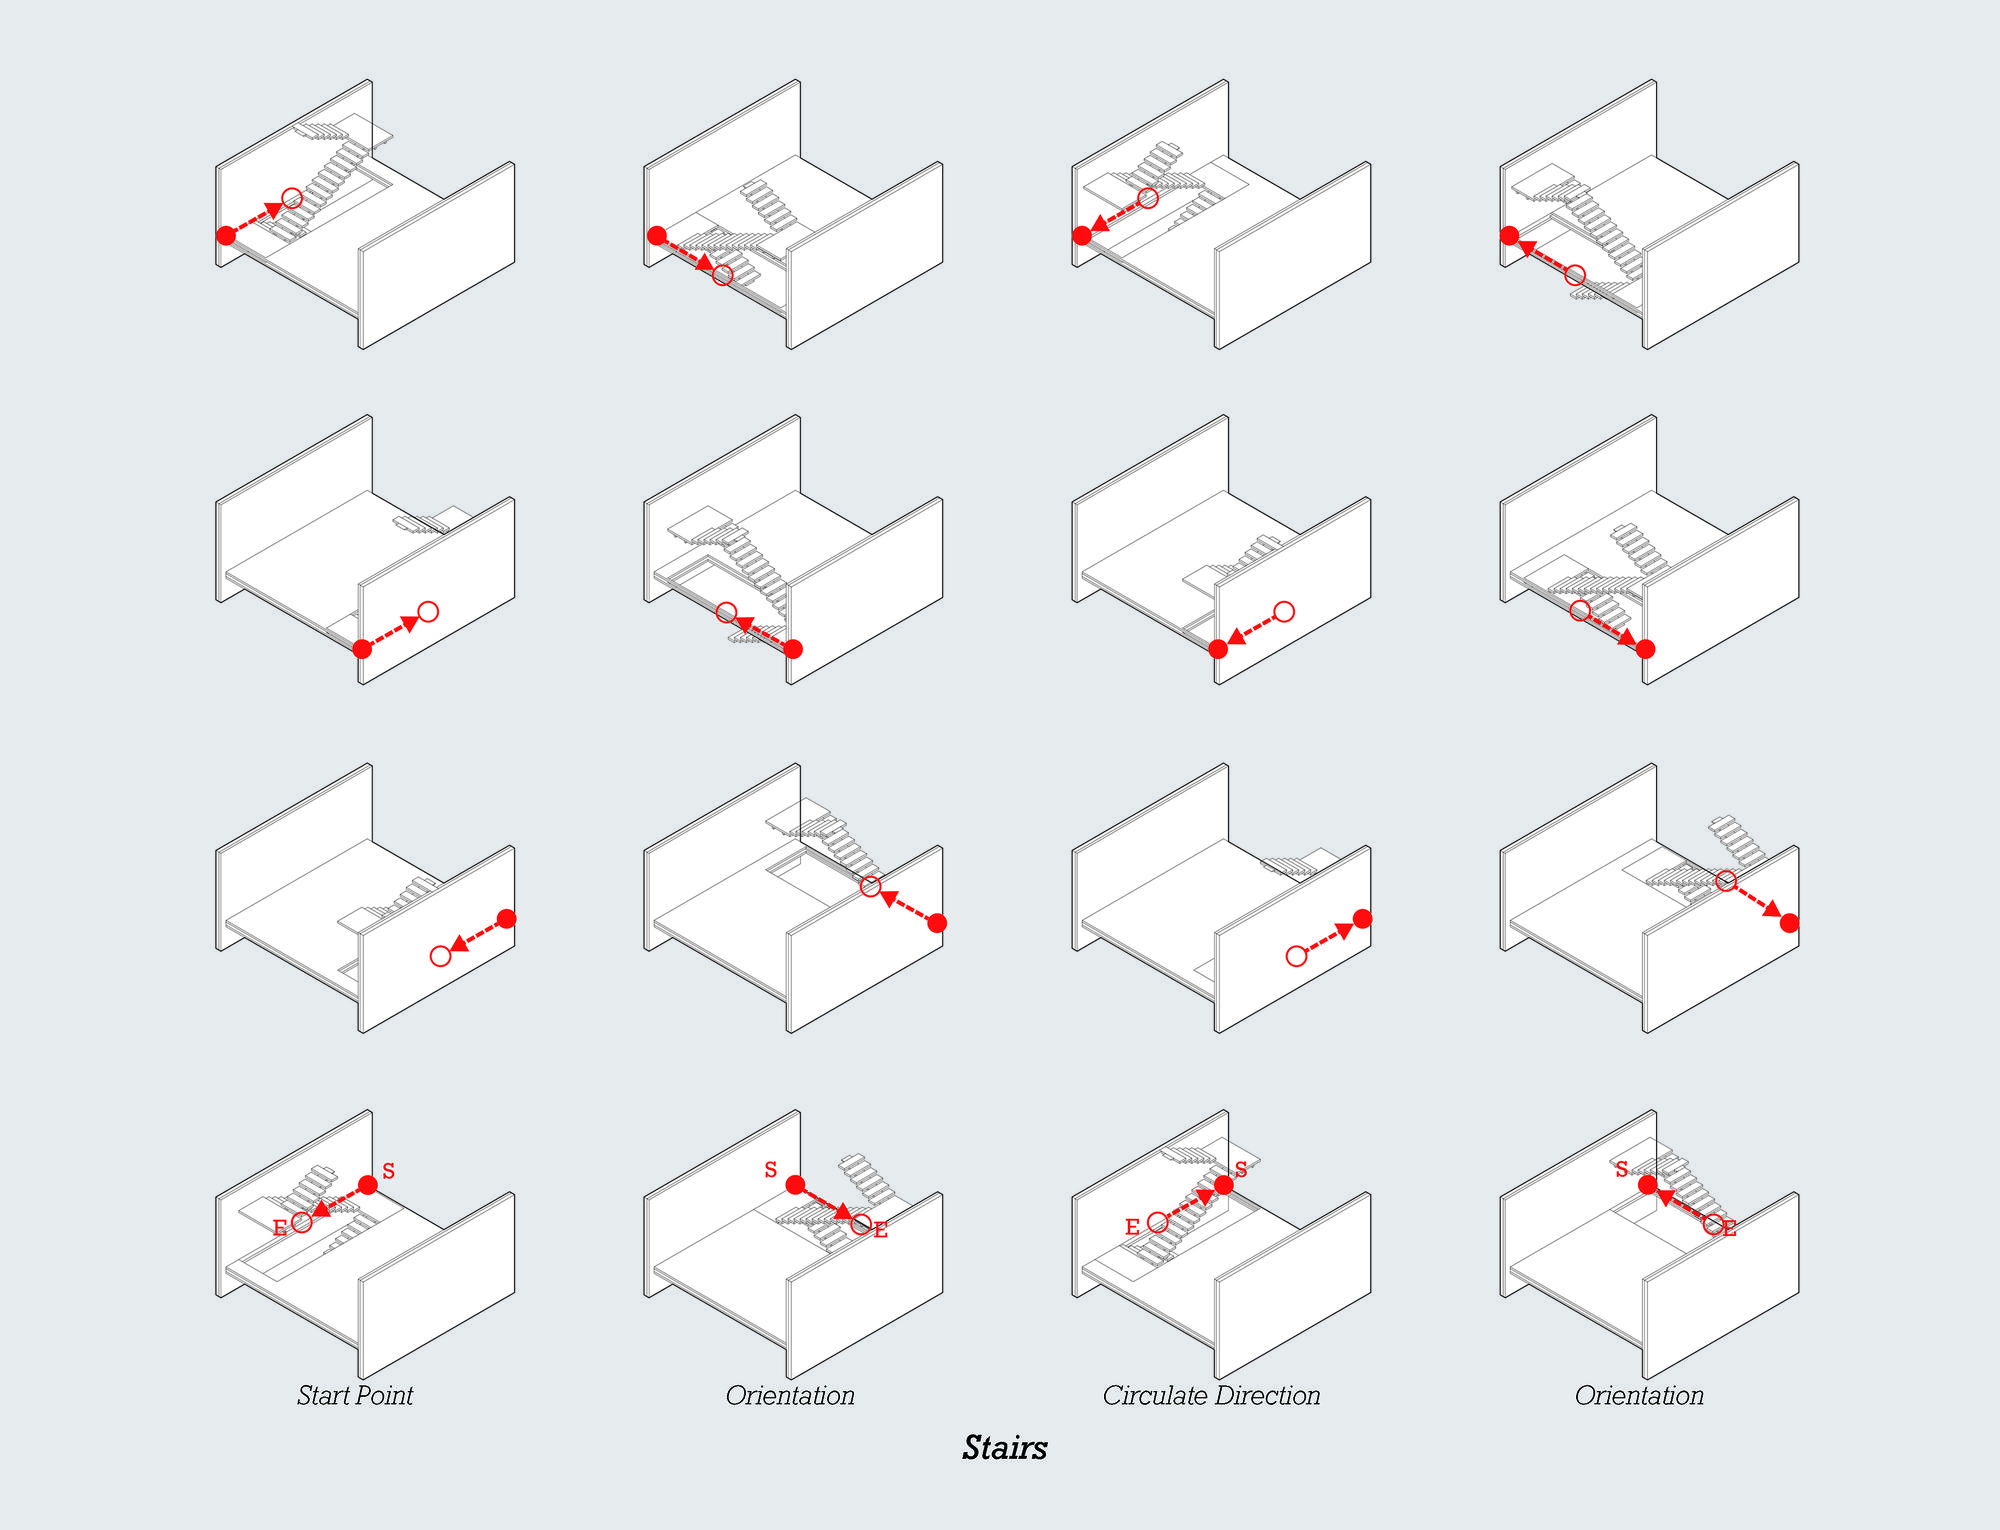
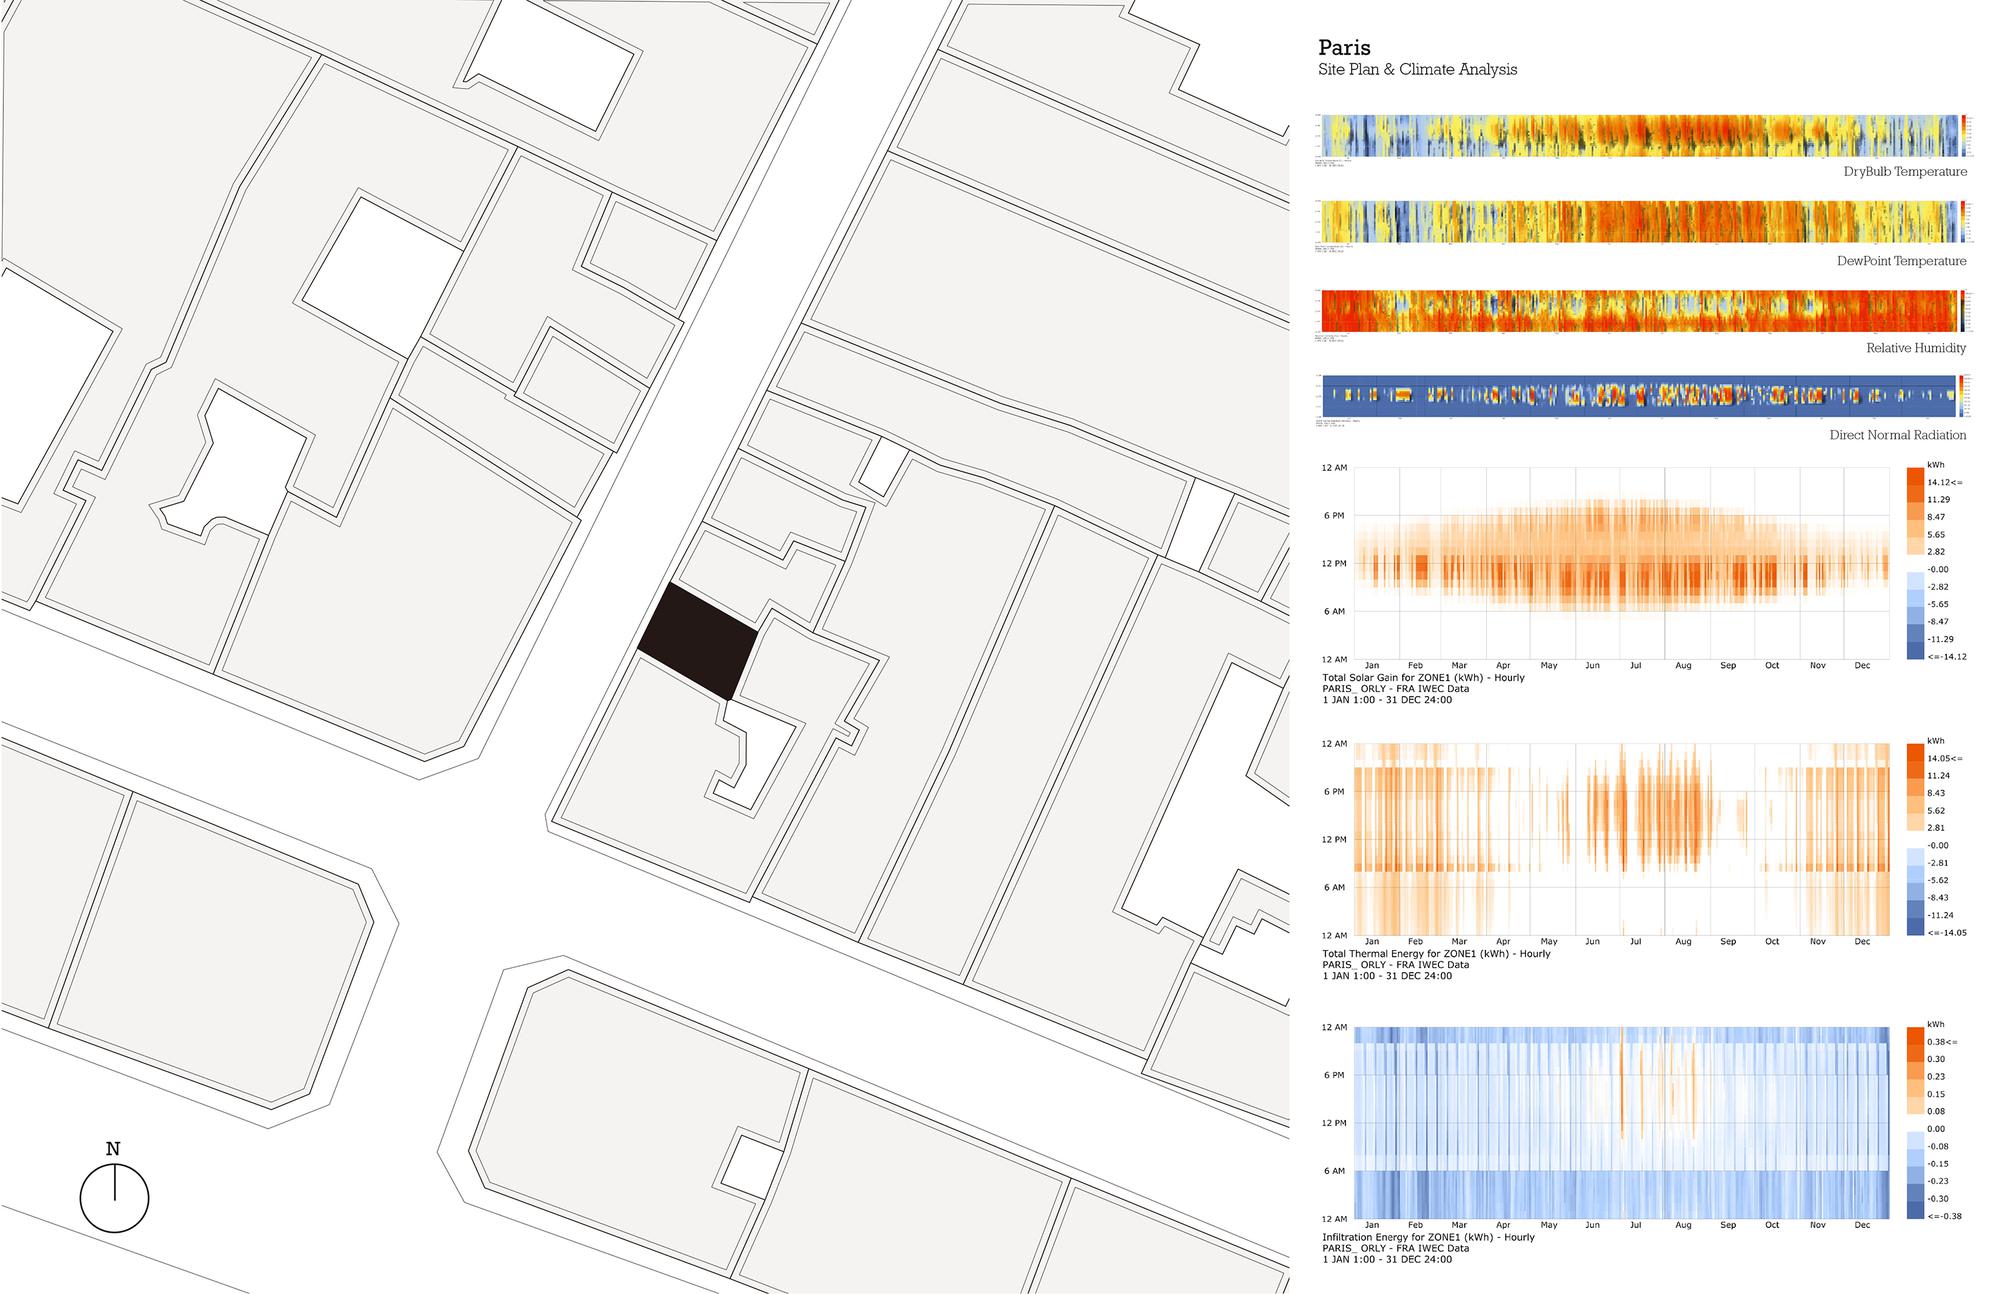
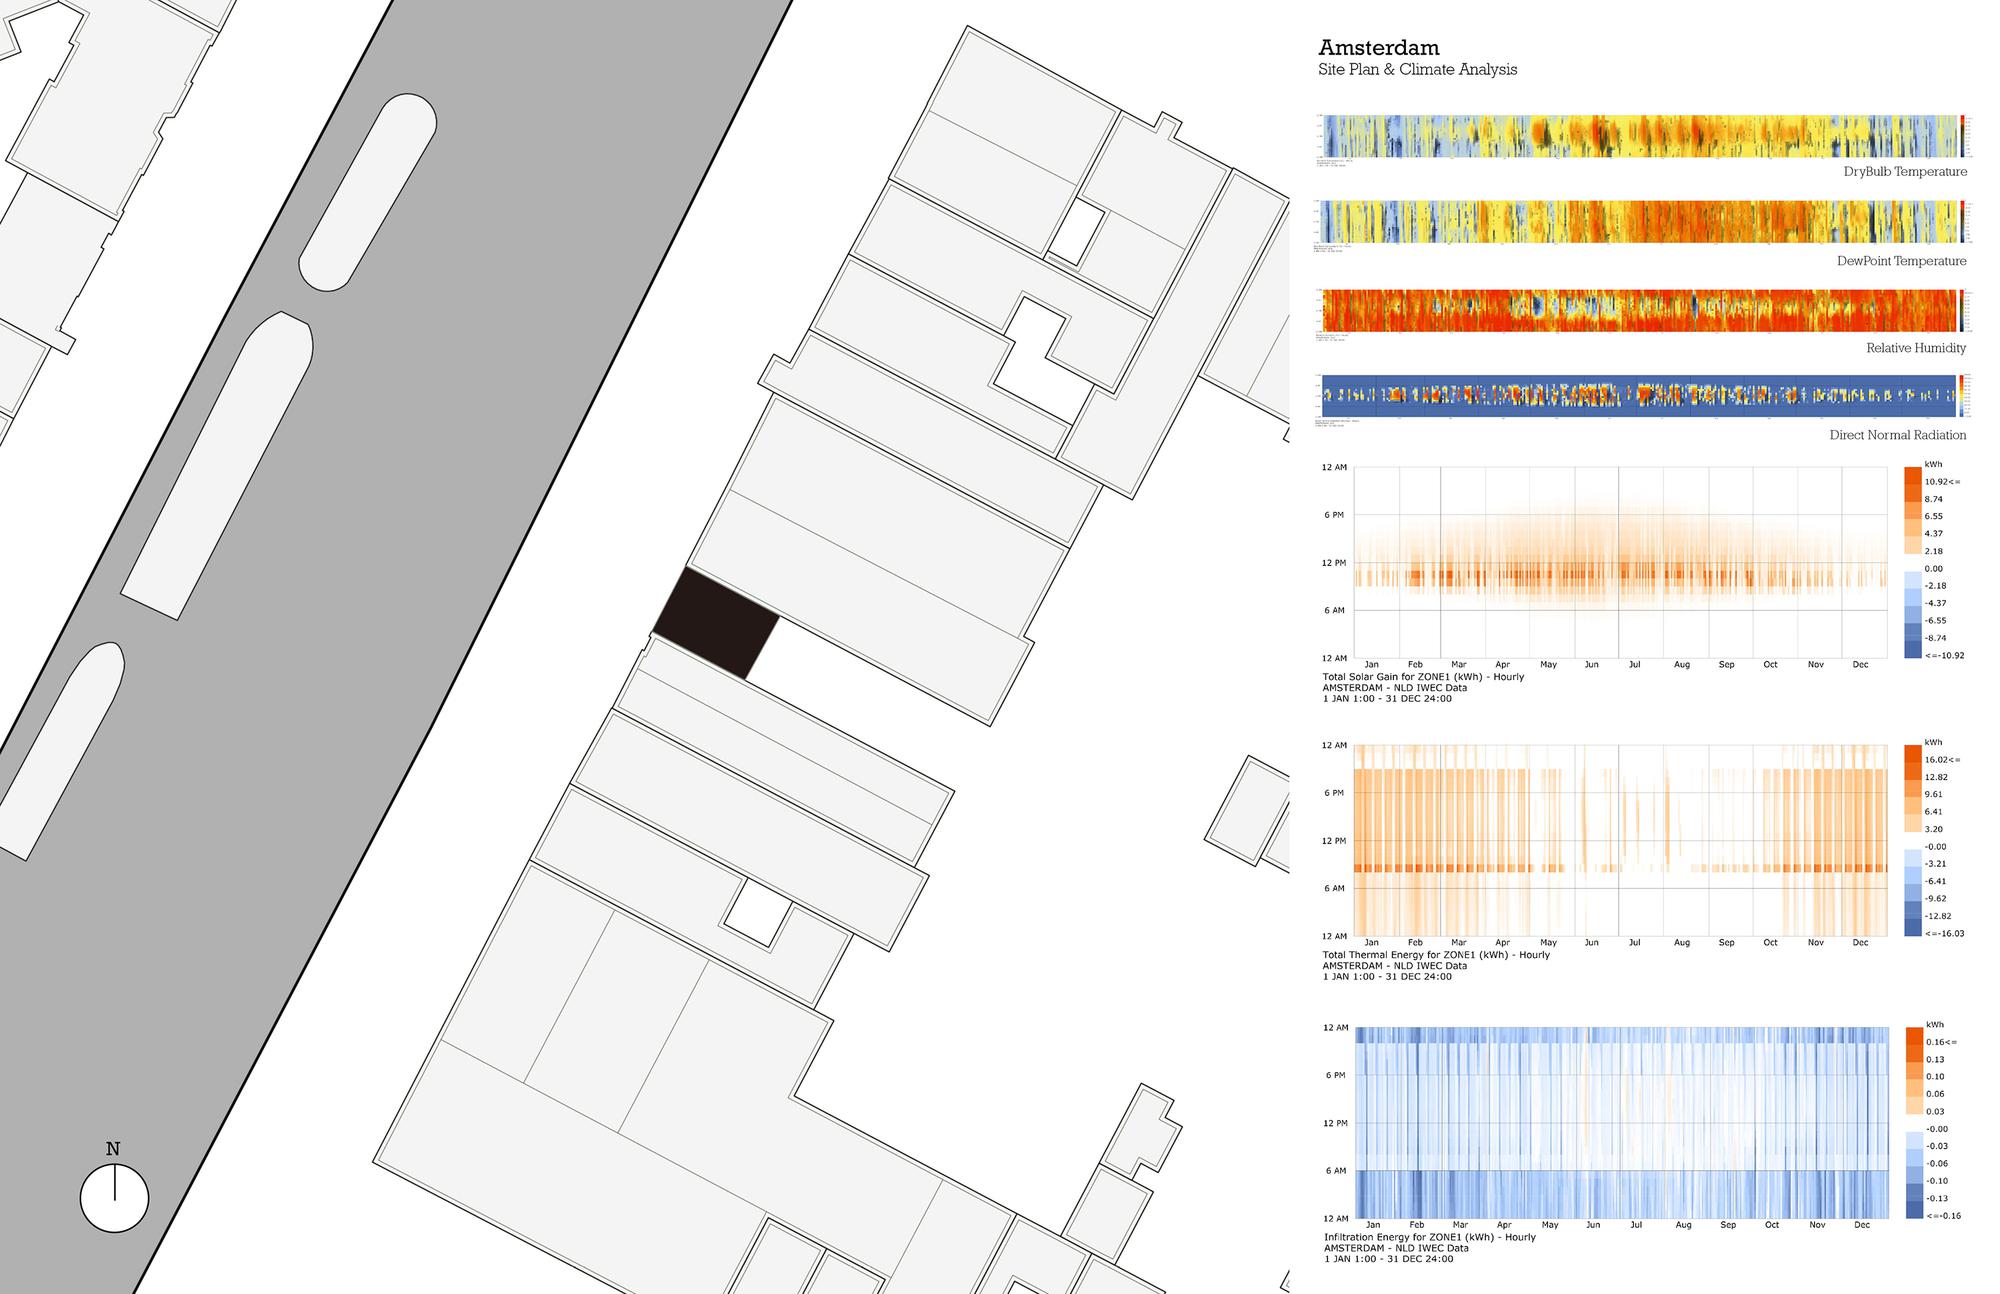
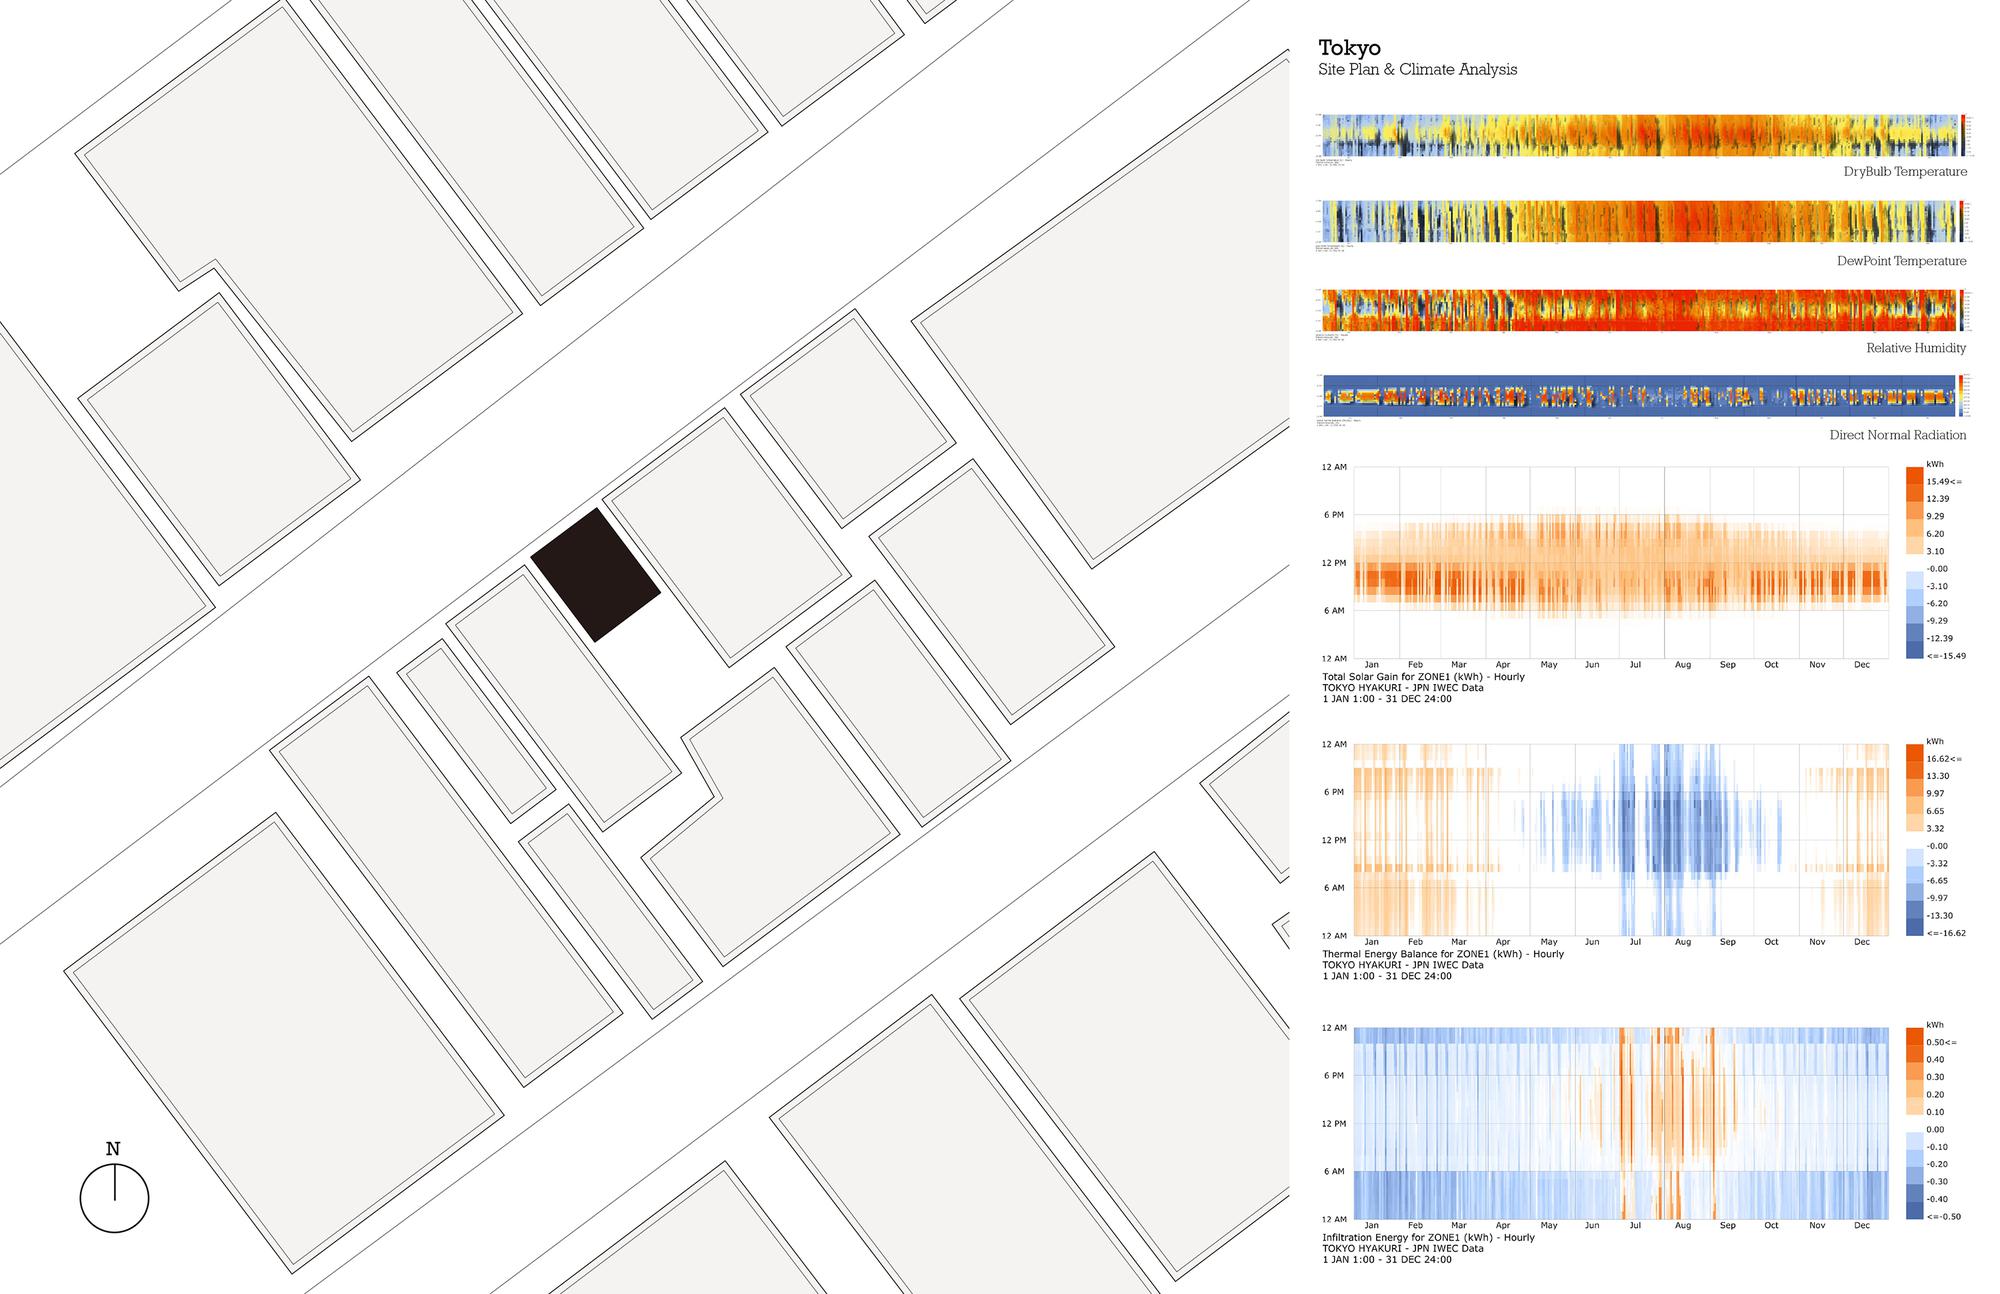
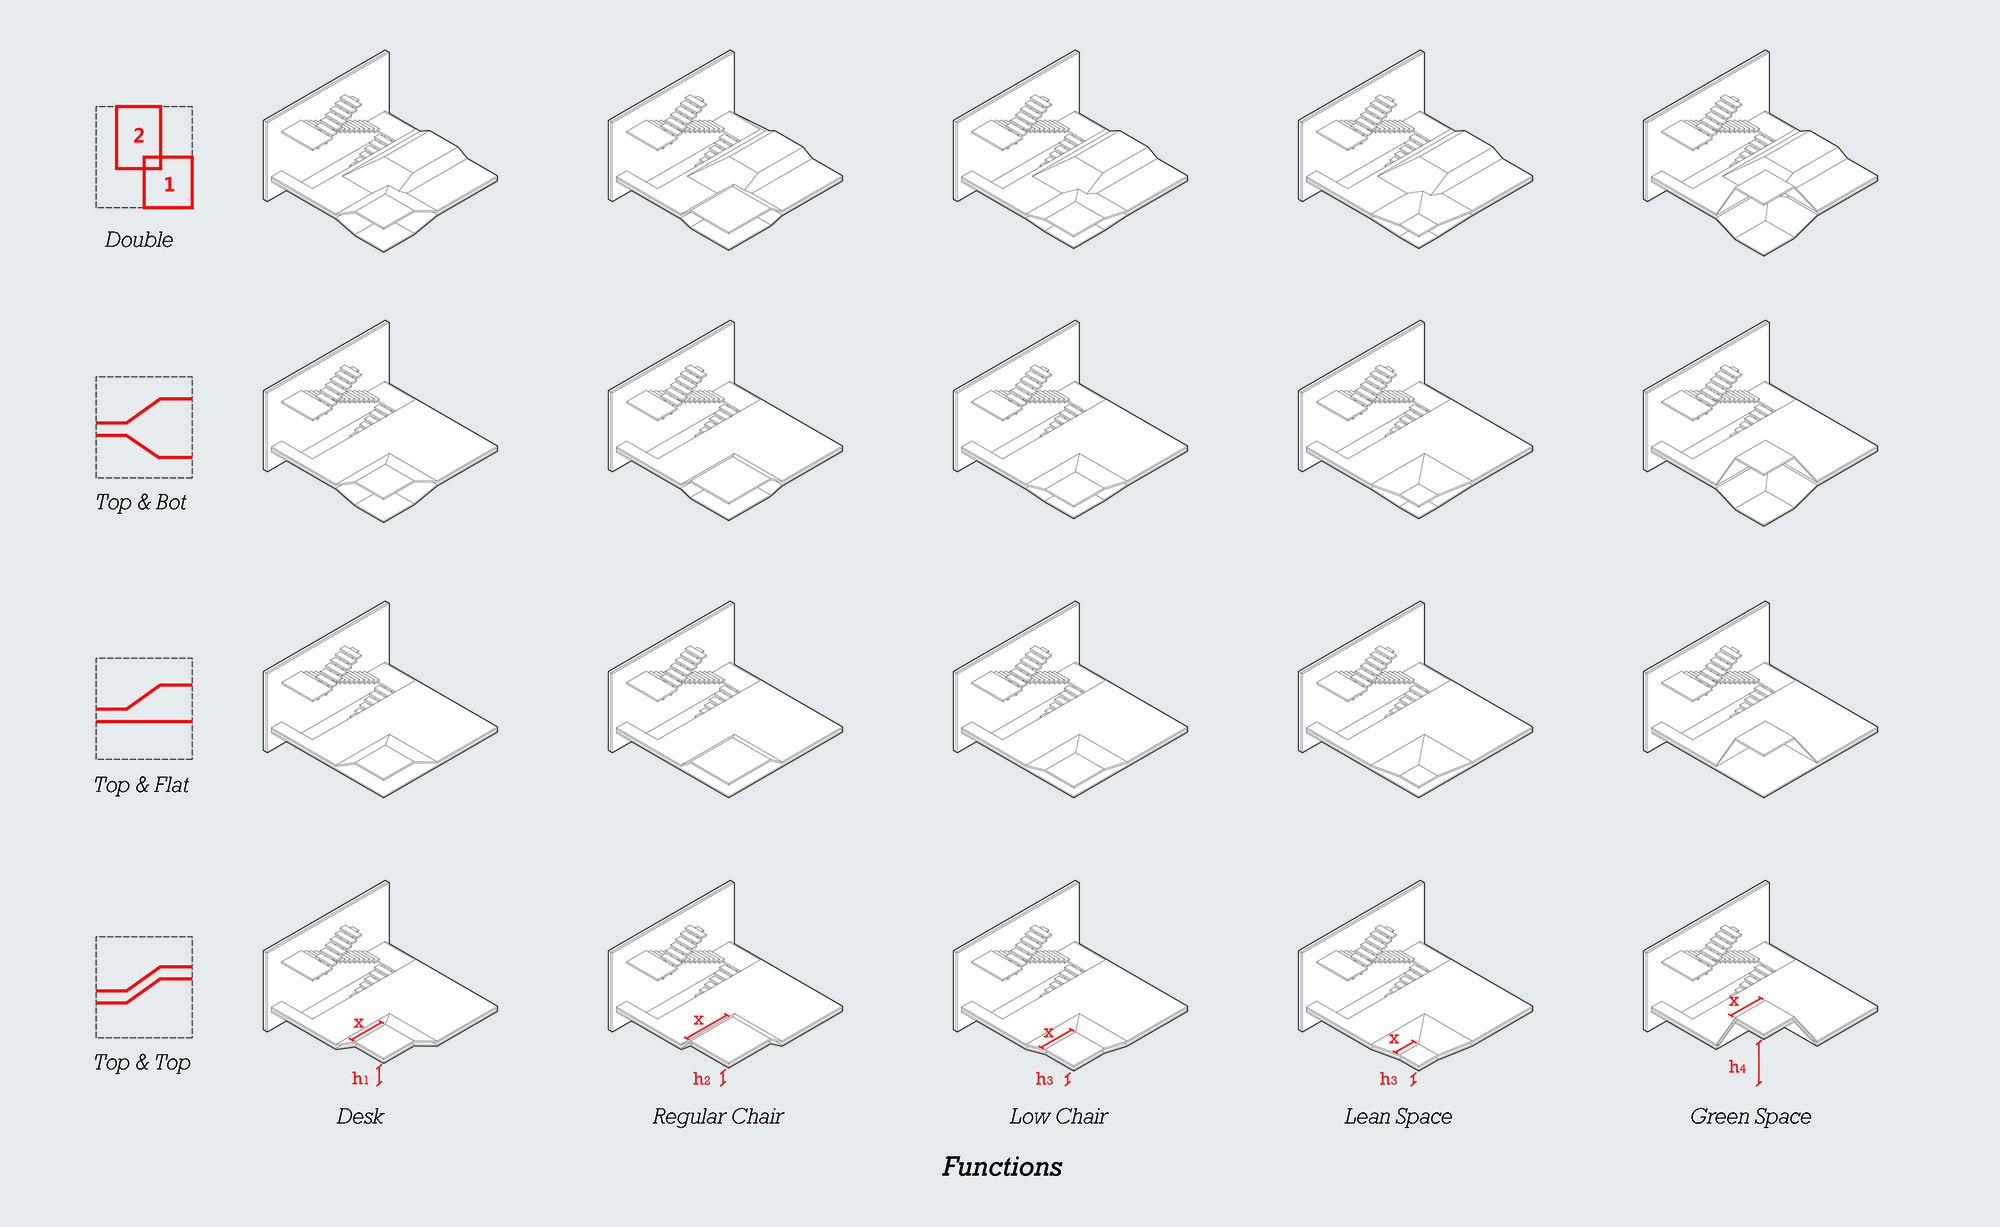
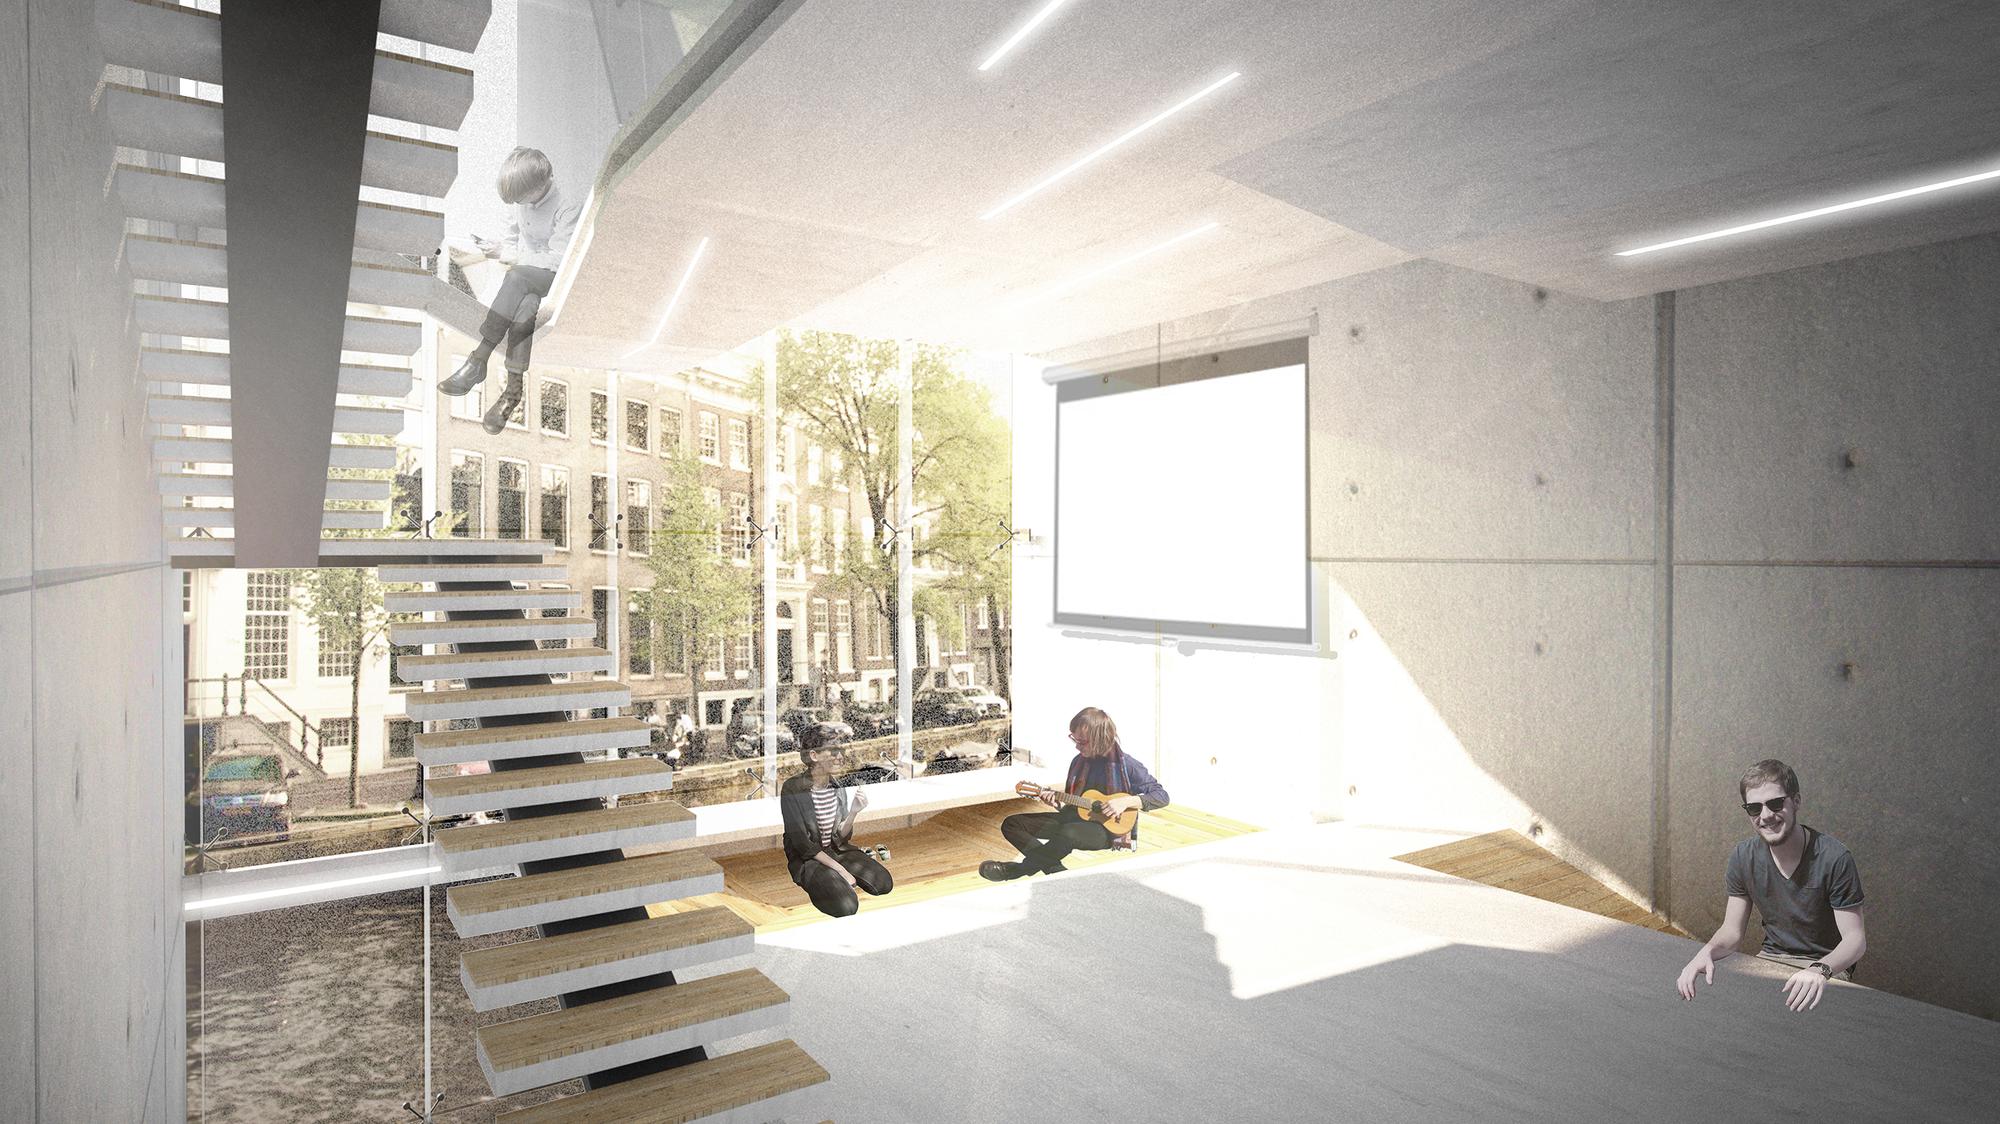
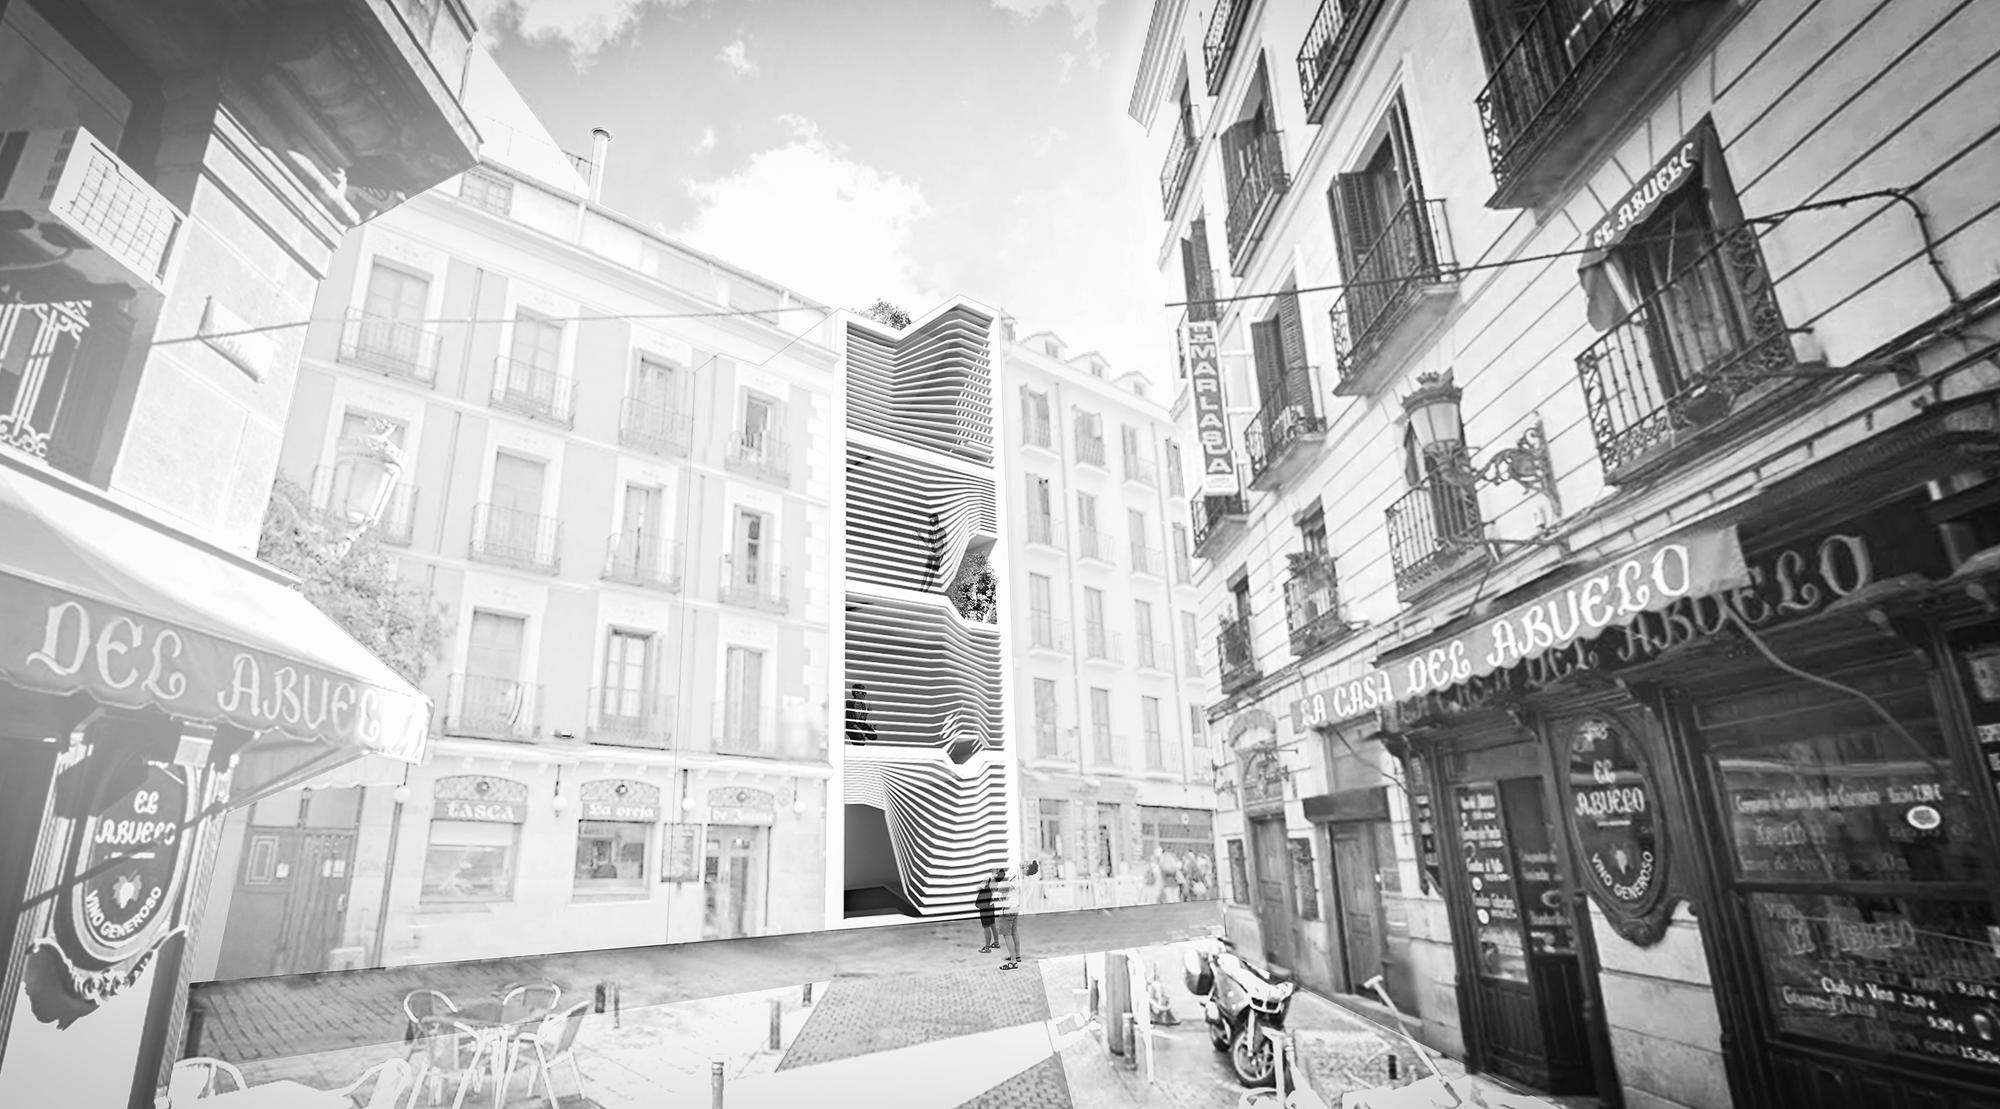
Two proposals are offered that seek to exploit these benefits: a corporate campus in downtown Oakland, and four satellite offices across the world. The former employs a generative system which, accounting for a variety of information regarding this site, produces a design for an office space and surrounding landscape via a series of cascading rules. In contrast with the horizontal campus, the satellite offices are vertical, situated within infill sites. Keeping in the same formal logic of their home office, each is based on a similar parametric model that also incorporates data from a thermodynamic simulation.
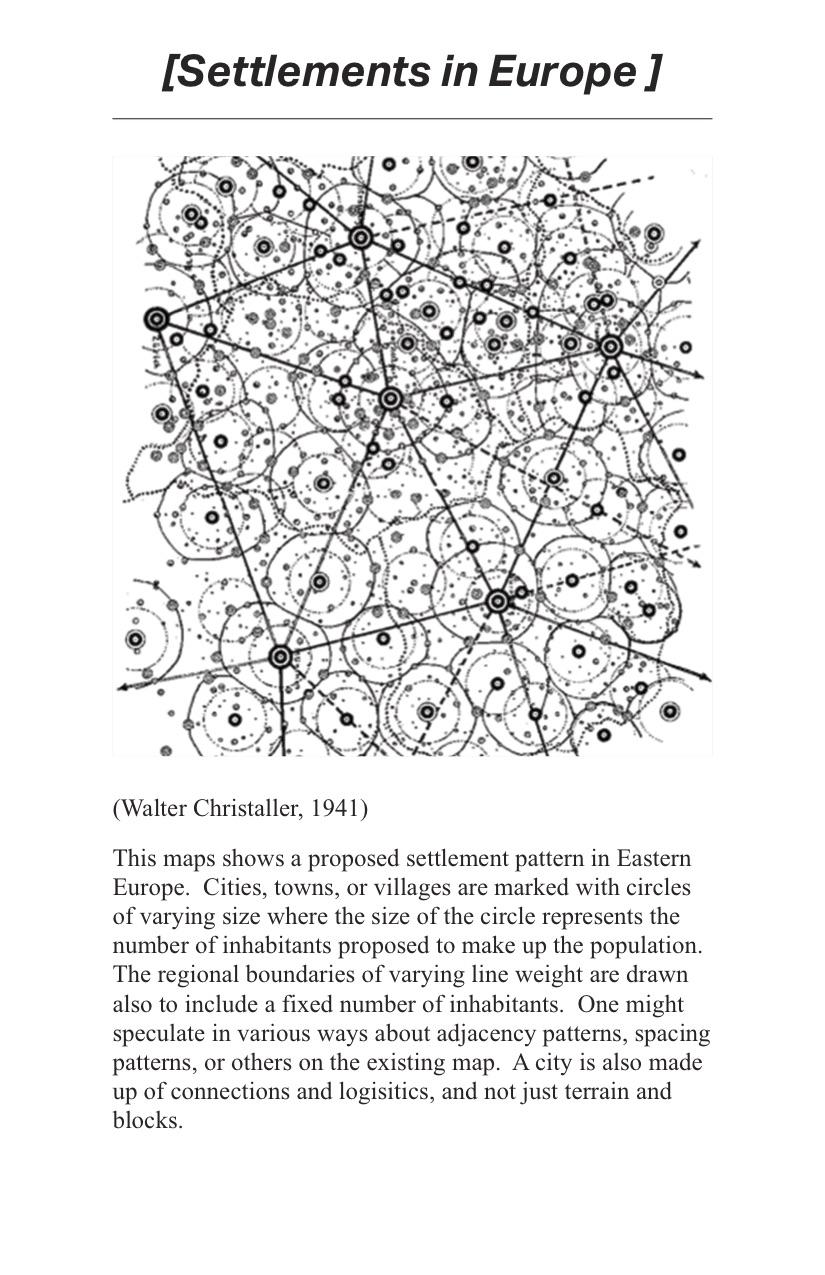
This maps shows a proposed settlement pattern in Eastern Europe. Cities, towns, or villages are marked with circles of varying size where the size of the circle represents the number of inhabitants proposed to make up the population. The regional boundaries of varying line weight are drawn also to include a fixed number of inhabitants. One might speculate in various ways about adjacency patterns, spacing patterns, or others on the existing map. A city is also made up of connections and logistics, and not just terrain and blocks.
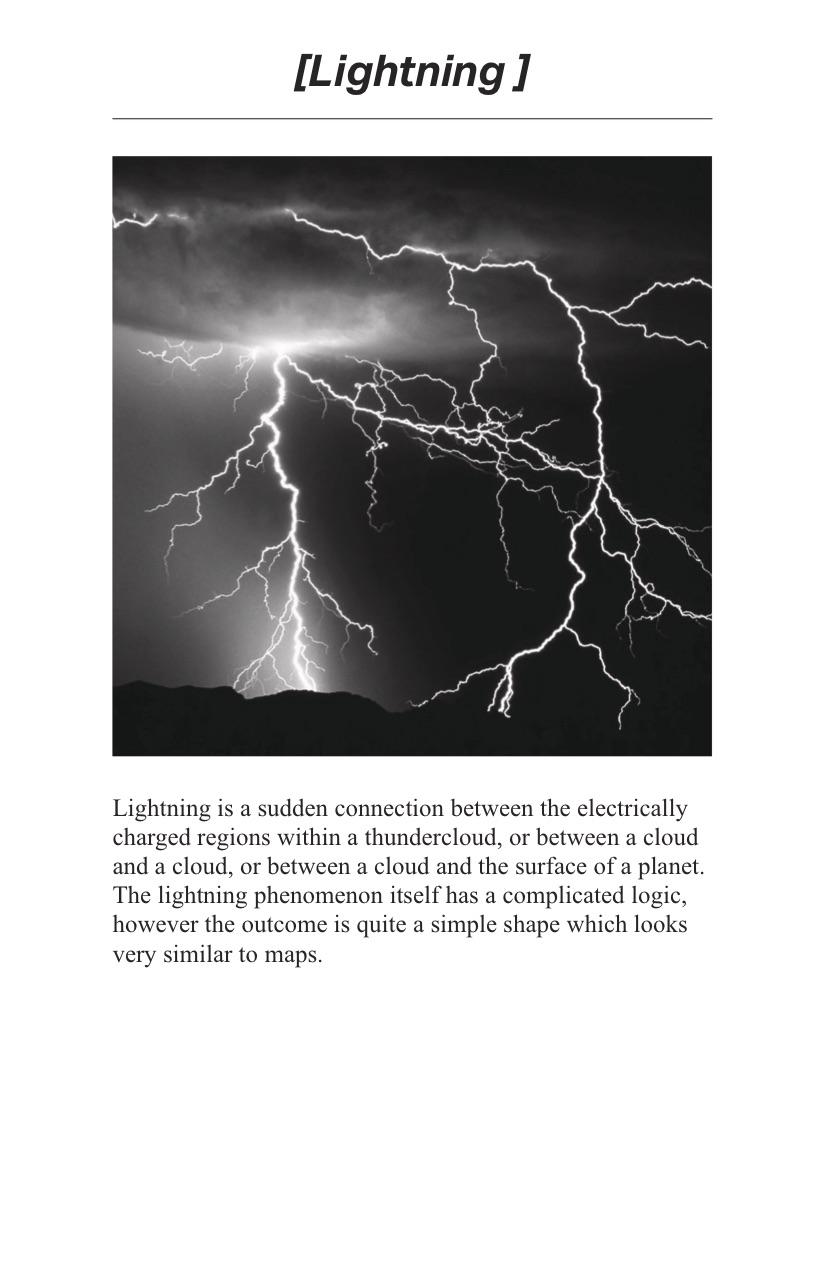
Lightning is a sudden connection between the electrically charged regions within a thundercloud, or between a cloud and a cloud, or between a cloud and the surface of a planet. The lightning phenomenon itself has a complicated logic, however the outcome is quite a simple shape which looks very similar to maps.
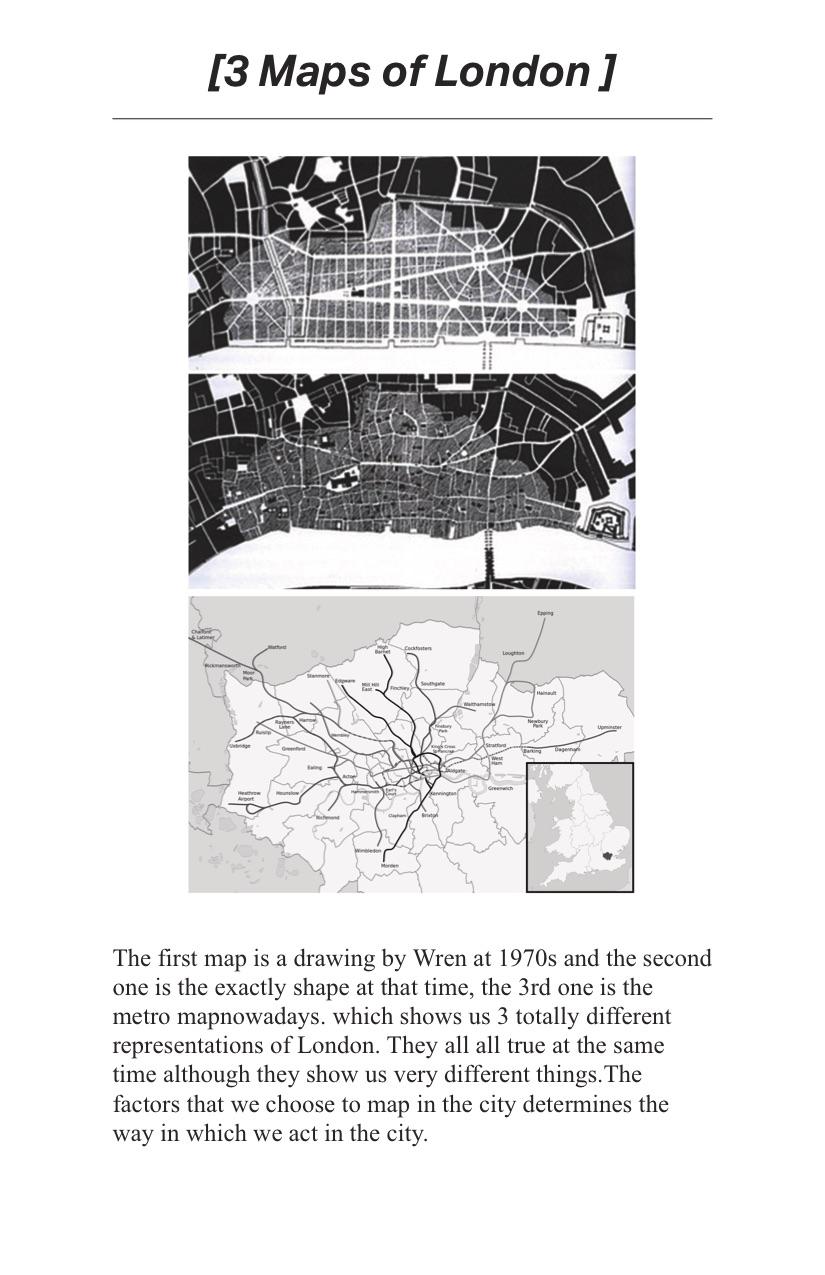
The first map is a drawing by Wren at 1970s and the second one is the exactly shape at that time, the 3rd one is the metro map now a days. which shows us 3 totally different representations of London. They all true at the same time although they show us very different things. The factors that we choose to map in the city determines the way in which we act in the city.
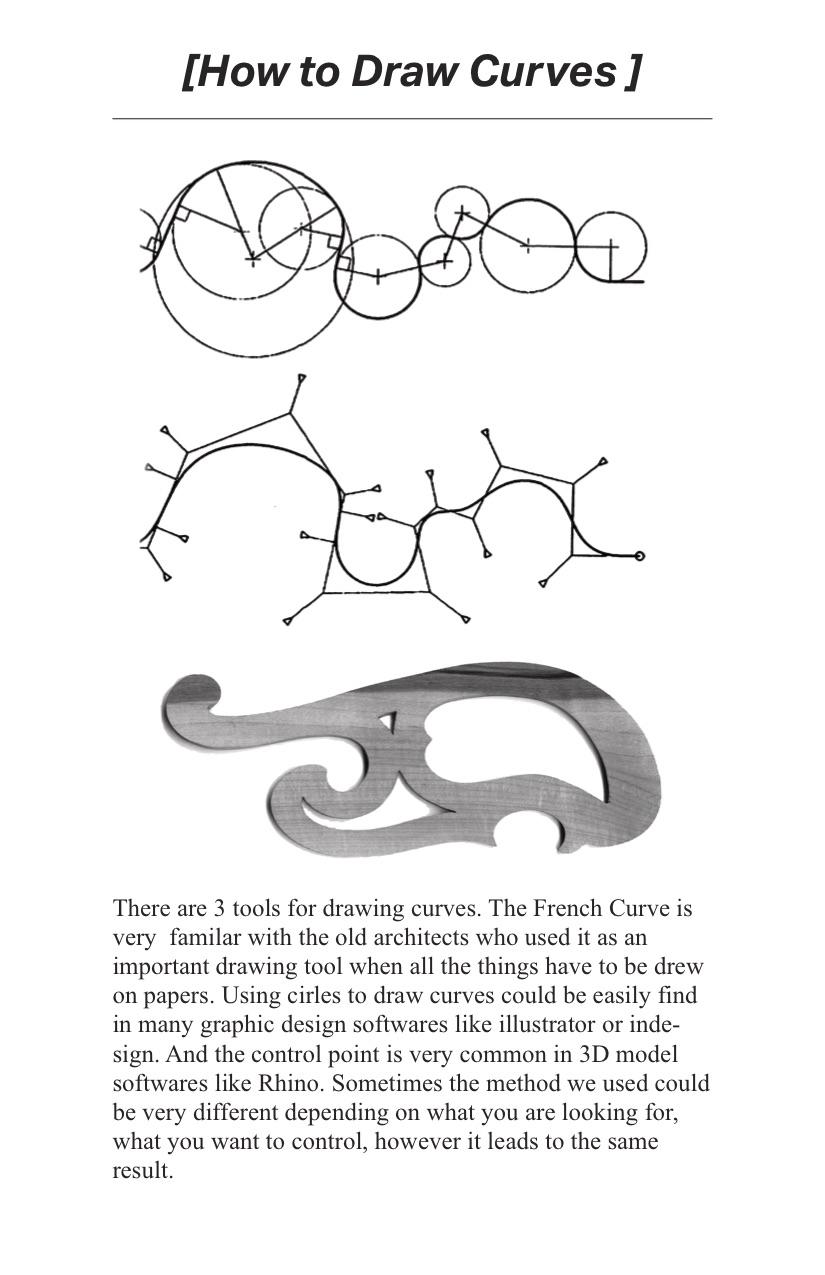
There are 3 tools for drawing curves. The French Curve is very familiar with the old architects who used it as an important drawing tool when all the things have to be drew on papers. Using circles to draw curves could be easily find in many graphic design softwares like Illustrator or InDesign. And the control point is very common in 3D model softwares like Rhino. Sometimes the method we used could be very different depending on what you are looking for, what you want to control, however it leads to the same result.
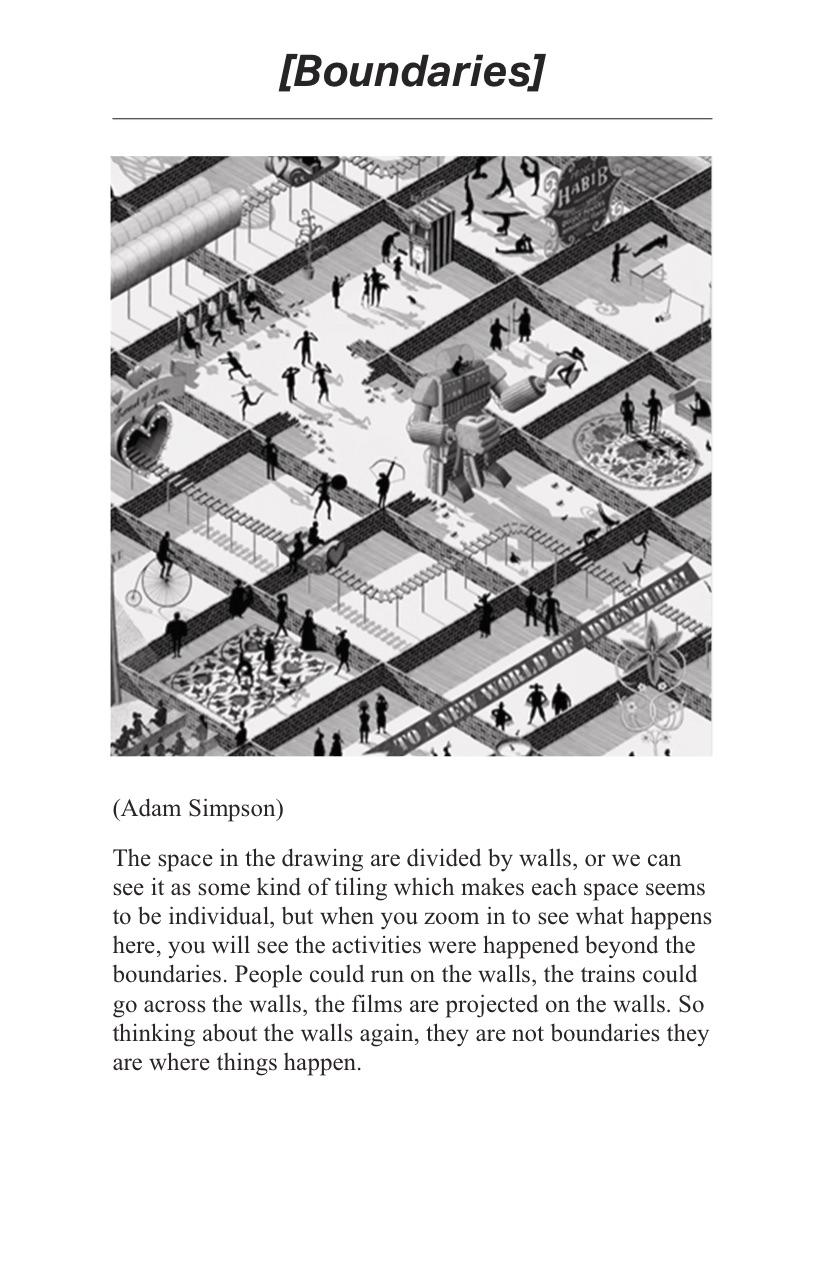
The space in the drawing are divided by walls, or we can see it as some kind of tiling which makes each space seems to be individual, but when you zoom in to see what happens here, you will see the activities were happened beyond the boundaries. People could run on the walls, the trains could go across the walls, the films are projected on the walls. So thinking about the walls again, they are not boundaries they are where things happen.
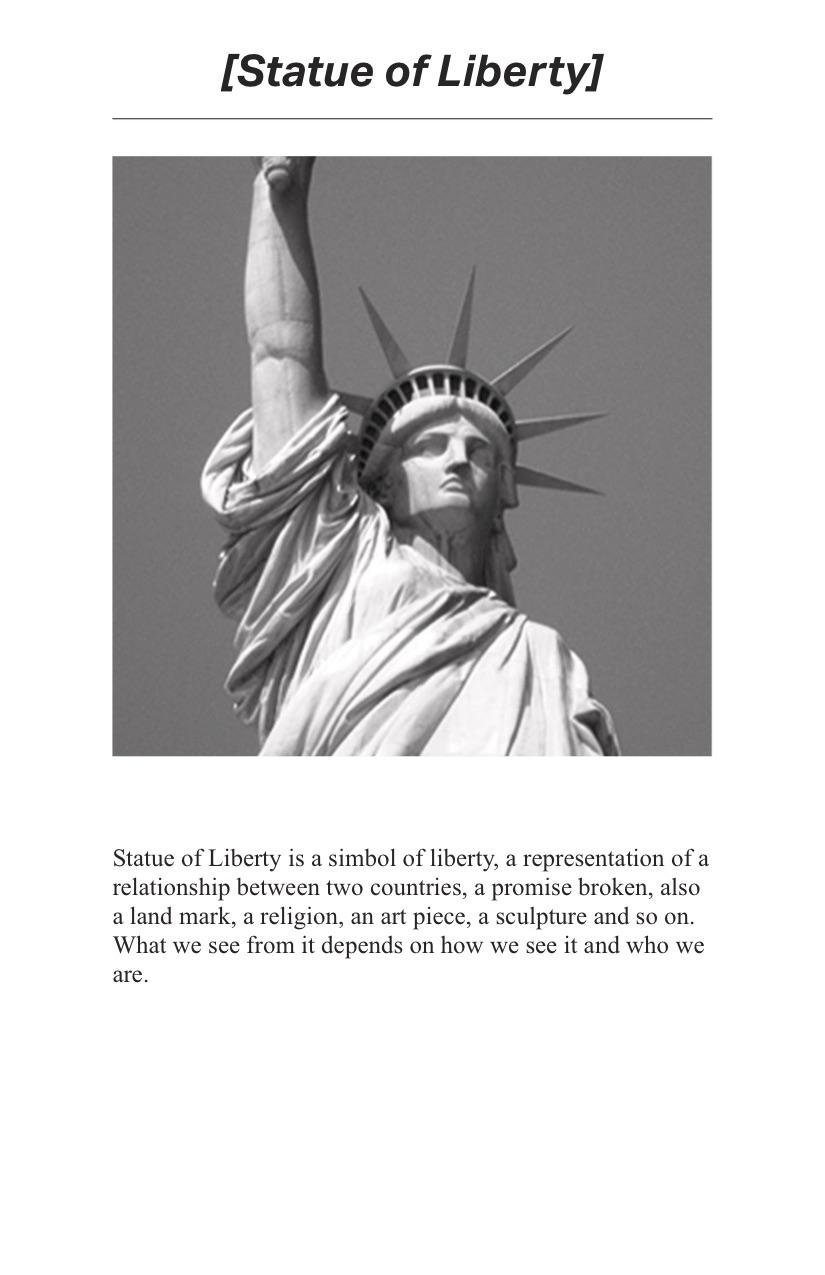
Statue of Liberty is a symbol of liberty, a representation of a relationship between two countries, a promise broken, also a land mark, a religion, an art piece, a sculpture and so on. What we see from it depends on how we see it and who we are.


There's more!
Some other projects from this same class have been posted, as well as some interesting student work from this same year.